Dynaflow’s DF_Contour generates publication-ready graphs and contours from numerical and experimental data. It produces colour graphic representations of various data types, including vector and scalar fields, shapes, curves, and markers. It can also generate animations of a succession of colour maps.
The software reads data from simple user-generated ASCII file format. The software is easy to use; To identify the type of data and how to represent it, DF-Contour requires a simple one-word descriptor (i.e. #vector or #scalar) at the beginning of each data set. The software is intuitive and follows the familiar Windows interface and commands.
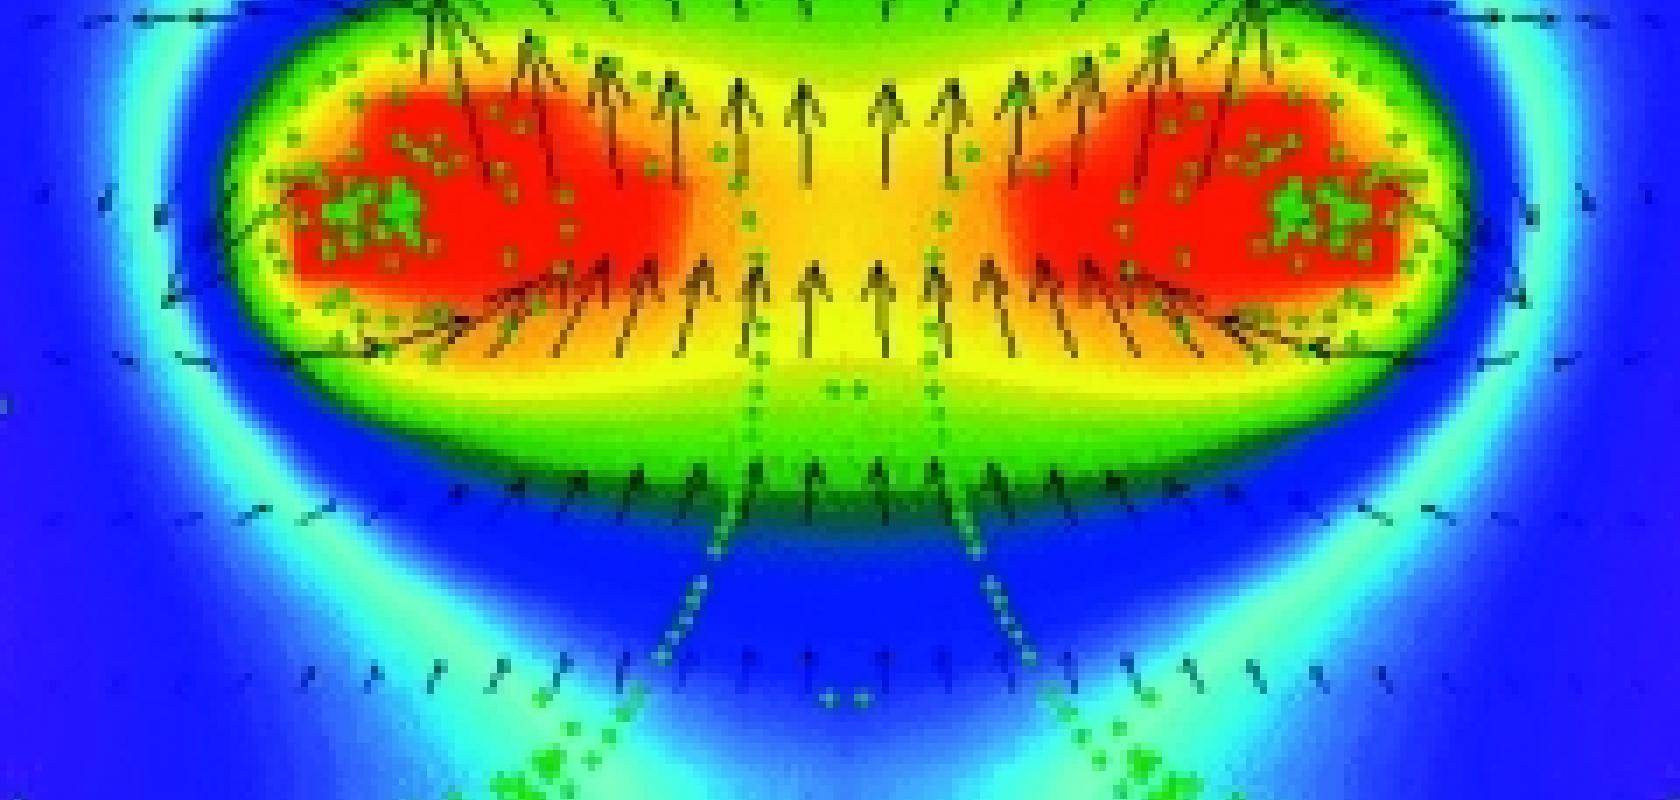
Users can view 16 different data sets simultaneously. It contains a comprehensive colour palette, which can be defined by the user, and it can create vector and scalar colour contour plots.