As a child I lived, for a while, on open plains where (like all my schoolmates) I was fascinated by glimpses of how transport might be in our future. The P1127 (an experimental VSTOL aircraft that would later become the Harrier); the Belvedere (a twin rotor helicopter, already aging and soon to be swept away by the Chinook); and, most exciting of all, something which we heard but never saw.
This gave rise to one of my earliest serious data gathering and analysis projects: a notebook in which I religiously recorded details of everything mechanical that moved and, with particular attention to detail, involved rocket test firings. The date, time and direction for every roaring launch, every thud of a concrete warhead returned to earth, went into my little book.
After a while, though I didn’t know the term ‘data analysis’, I was able to tell my friends with fair accuracy when the next launch was likely to be, how long the flight would take and where the impact would probably be.
These rockets had mysterious names like Honest John, Thor, Thunderbird and Bloodhound. Fifty or so years on, another rocket bears the Bloodhound name, but without the warlike aura. This one aims to transport a human being, not an explosive charge, in an attempt upon both the land and low-level aviation speed records at 1.4 times the sea level speed of sound. At the same time, it is generating data and methods for spin-off into wider scientific and technological theatres, and scientific computing is at its heart.
The Bloodhound missile was, strictly speaking, not a rocket at all. Its flight was powered by two ramjets, but rocket boosters were used to generate the initial airspeed necessary for those ramjets to ignite. The new bloodhound also uses multiple engines, but here the relationship is reversed: the rocket provides the primary propulsion, with a jet engine serving as the initial accelerator. The jet engine is one designed for the Eurofighter; and the rocket is a hybrid design, burning synthetic rubber solid fuel with a liquid HTP (high test peroxide) oxidiser reacting with a fine silver mesh catalyst. There is also a third engine, designed for Formula One racing cars, which serves as a fuel pump delivering the HTP to the rocket at the required pressure (more than five and a half million Pascals).
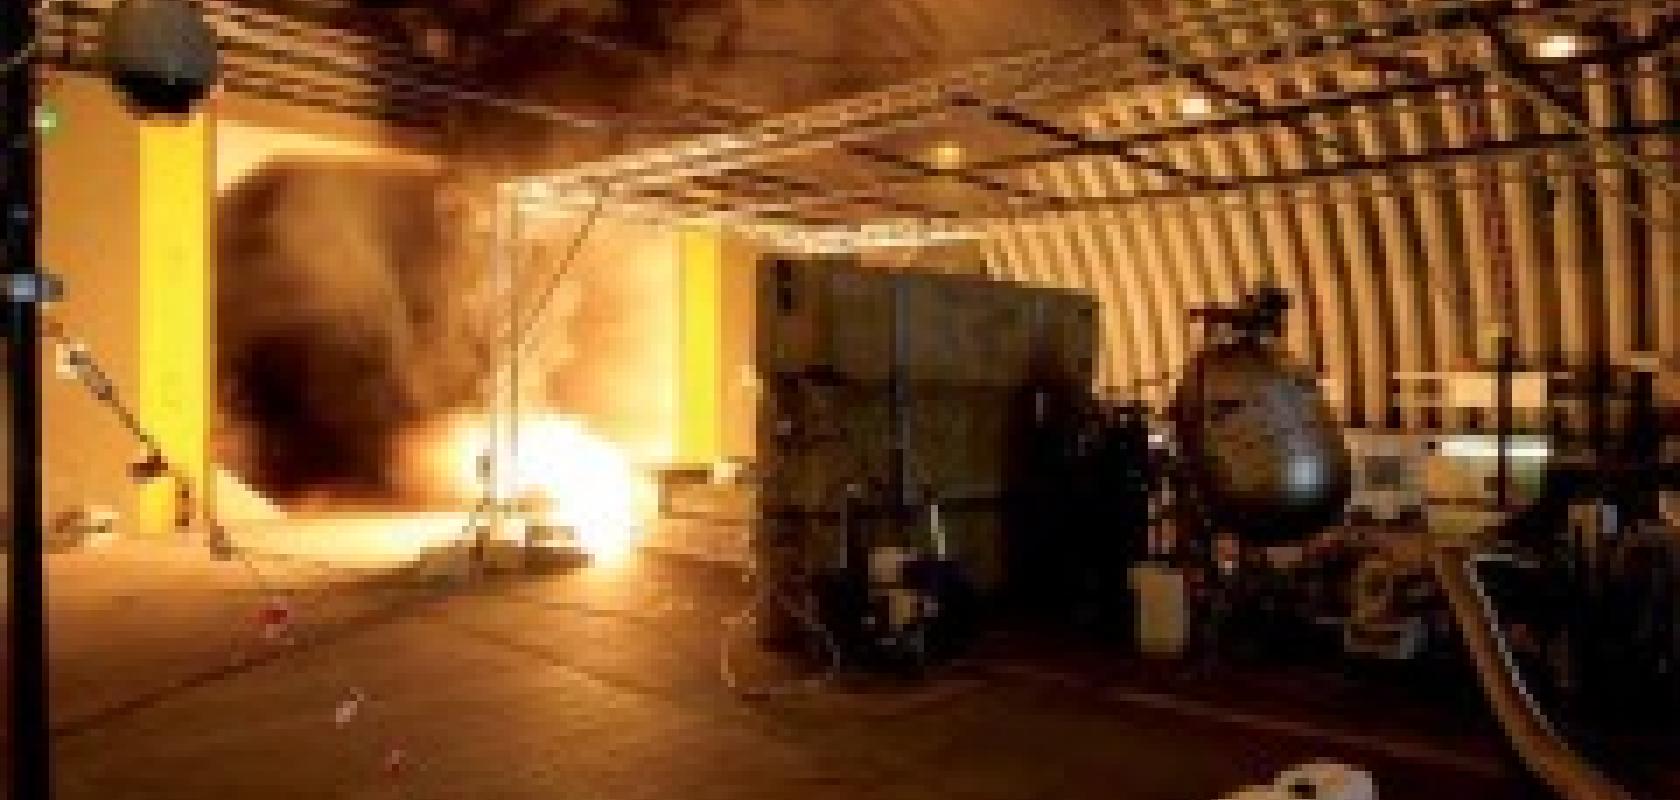
All of this (even without other components such as a custom-designed gearbox) adds up to what Coorous Mohtadi of MathWorks summarises as an ‘extremely harsh environment with a mixture of technologies in close proximity, which would under any other circumstances probably not be combined.’ Well-known software names are found throughout the Bloodhound SSC literature, and MathWorks is prominent.
A complex set-up means data collection is highly stressed. Every component is operating in unknown conditions, placing existing manufacturer and operator data outside useful bounds – Rolls Royce, for instance, has accumulated plenty of data on the jet engine, but in an aircraft where none of Bloodhound’s complex ground and interactive thrust vibration patterns would have existed.
The data gathering is essential to performance optimisation, but configurability requirements not present in the original roles of the components render normal redundancy insurance measures impossible. Collection is at one millisecond resolution; remember that at maximum car speed that represents roughly half a metre displacement, with everything controlled by a human driver’s reactions. Each component has its own data capture system, but these also have to be able to read and respond to each other’s information flows.
A Matlab and Simulink environment contains design, modelling and implementation, allowing numerous design iterations to be modelled and simulated quickly. Real-time code is automatically generated using model-based design, and xPC Target software performs control and data acquisition from within Simulink. ‘The graphical nature of modelling,’ comments Coorous Mohtadi, ‘allows a multi-disciplinary team approach to design and review that would be impossible with traditional document-based systems.’
Wheels nearly one metre in diameter help to minimise the effect of surface irregularities but, for a car travelling at these velocities, the flattest possible site is needed. Here, again, innovative new data-driven approaches have been used (see box: Finding flatland).
Looking more widely, transport design depends heavily on feedback from test data into the design process. This is increasingly so as vehicle engineering becomes more complex and multidisciplinary, but also becomes more difficult as new methods compress timescales. All too often, insights come too late to be incorporated as fully as the designers would like. Maplesoft, a software publisher with well-known relationships across the transport manufacturing sector, is one of the contributors behind VI-grade’s VI-DriveSim Dynamic simulator, which aims to provide test drivers with an intermediate stage between virtual prototyping and physical testing.
The simulator runs a virtual mathematical model of the vehicle and track linked to a ‘six degrees of freedom’ Ansible Motion platform, with Maplesoft’s MapleSim providing the inverse relationships acquisition which underpins realistic response. Driver actions are the inputs and the platform provides real-time inertial response from the vehicle model, allowing natural interaction between human driver and virtual vehicle. The resulting experience provides data that can be analysed and returned to the design cycle for refinement and validation.
Most of us, of course, are transported at speeds somewhat lower than Bloodhound’s 480m/s, or even a racing car’s 85m/s. On the other hand, we also move around at spatial densities considerably greater than Bloodhound’s one passenger per hundred square kilometres. A great deal of data analysis effort has to do with planning, improving and optimising mass transport infrastructures against one set of criteria or another: safety; efficiency; economy; productivity; volume of throughput; and quality of outcomes. There are statisticians out there studying the problems of motorway traffic, rail scheduling, the mixing of pedestrians with disability scooters, and almost anything else you can imagine.
One study[1] (which I haven’t space to do justice here), for example, analyses the comparative sleep patterns of heavy goods vehicle drivers at home and on the road to develop research on safe driving legislation. At sea, Formal Safety Assessment (FSA) of evaluation of maritime regulations, for instance, is highly dependent upon analysis of accident data, which makes it sensitive to incompleteness in the databases used. Examination of historical data shows[2] that, even in highly developed jurisdictions such as Britain and Norway, true figures suffer dramatically from under reporting with upper bounds in those two being <30 per cent and <41 per cent respectively.
Right down at the opposite extreme of the automotive scale from Bloodhound, one of my students, inspired by a combination of The Straight Story[3] and DARPA’s quadrupedal LS3 robot packhorses to examine low-powered transport options, is conducting a diligent data analytic investigation into the success/failure probability components of riding modified motor mowers and battery powered mobility scooters from Coleraine to Cork. His data capture hardware is, like Bloodhound’s, based on off-the-shelf Intel Atom-based hardware, though his sampling resolution is only five seconds from just over 120 concurrent channels and his analysis is in Maple, R and MiniTab. This is an entirely serious undertaking, designed (like Bloodhound) to generate data and starting points for new lines of thinking.
Perhaps of more immediate impact are the studies (see Box: Walking back to happiness?) of links between healthy lifestyle and the development of infrastructures designed to encourage walking and cycling.
Infrastructures are at least as much a result of transport as shapers of it. While Phillip Pullman painted in The Amber Spyglass[4] an intriguing picture of a world where pre-existing geological flows favoured a symbiotic vegetable and animal evolution leading to natural development of the wheel, in our own world it has been very much the other way around. Natural communications such as rivers decided the initial throw of settlement patterns, but then paths were beaten between them. The wheel required long, flat ribbon roads that were laid as enhancement of, rather than to provide, the routes for transport. This ever-expanded network of flat, wheel-friendly surfaces has progressively shaped the landscape wherever humans are found, in a circular structure of cause and effect, but one driven by transport demand.
This sort of big picture is very easy to see in historical hindsight, but not always as clearly visible as it happens. It has been hypothesised for a long time that transport foci are laying the foundations for new urban structures and defining new transport configurations in their turn. Any hope of influencing or even riding the wave fronts of change relies on attempting to get an overview of development mechanisms from within them, as they happen. In assembling such a big picture on the fly, however rough, data analysis is one of the best tools available.
Airports are a particular focus of interest in this respect, with debate over the posited emergence of ‘airport cities’. A paper[5] in Urban Studies for example, due to appear shortly before this issue of Scientific Computing World, analyses data showing that employment density within a four kilometre radius of large US airports runs at around 50 per cent (and increasing) of that in similar proximity to the commercial and business centres of their associated metropolitan areas and, most interestingly, anchors a considerable level of commercial activity unrelated to the transport function of the airport.
Similar analytic programmes exist elsewhere. A consortium of transport and social science specialists from half a dozen British and German academic institutions, funded by commercial and national development sources, is currently building a generic study model of metropolitan evolution within the catchment areas of European airports. Although generic, the model is being constructed using rules constructed (and allowed to grow in real time) from statistical analyses of real data from real specific locations. The model core is being built in Modelica, as a common platform, though there is much traffic between it and satellite models involving diverse tools including Matlab, Maple and MapleSim or Mathematica. The analytic side is similarly structured: a common basis in R, with subsidiary handling in everything from SigmaPlot to SAS.
As always, I have (inevitably) only had time to scratch the surface of computerised data analytic involvement in transport. Railway logistics is a big consumer; so are the scheduling, procurement, fare distribution and numerous other operations of the world’s airlines. Rapid transit systems are data-intensive; one underground railway systems analysis team I worked with on a research study referred to their data validation procedures with black humour as ‘The ticking of Pelham: 1, 2, 3’. The space industry, which transports equipment and other commodities into orbit, draws down streams of data for its own consumption is often working in the service of clients for who data collection is the whole point of the mission. Data, data, data, wherever (and however) you go!
References and Sources
For a full list of references and sources, visit www.scientific-computing.com/features/referencesdec12.php
‘This car is a one-off; the time and resources in any other project of this magnitude would require many people and be many times the cost. MathWorks gives us the tools that allow us to rapidly prototype the design with fewer resources. One of the biggest benefits is the fact we can do hardware in loop testing – this is invaluable in the timescale we have got, and it probably would not be possible without it.’
Joe Holsworthy, Bloodhound systems engineer
Finding flatland
Away from the engineering hothouse, Bloodhound Supersonic Car itself, data gathering and analysis have been equally important in selecting a flat site for the speed attempt. A novel progressive elimination method was used.
Endorheic salt pans provide the population from which to sample potential sites, and candidates were initially identified using digital elevation models constructed from Shuttle Radar Topography Mission data. At this stage, spatial resolution is about 90 metres and allows elimination of many candidates. Land cover data at kilometre resolution further winnow the selection by revealing those with unsuitable temporal flood patterns.
Likely locations were then analysed by an algorithm that computed elevation variance (using data from LandSat and other sources) at more than one kilometre pixels. Any consecutive series of 20 pixels (reflecting the necessary length of the speed record attempt site) with low variance emerged as sites justifying detailed investigation through hands-on human data gathering.
Walking back to happiness?
It’s generally taken for granted that policies 
favouring the development of environments that make walking and cycling easier, and car driving more difficult, will pay dividends in health and a reduced carbon footprint. A study in the Australian state of Victoria[6] explored attitudes to public health promotion policies, and found that those shaping environmental infrastructure earned approval while those that sought to encourage healthy eating environments did not. There is, however, remarkably little research into how true this assumption of infrastructural benefit might be in practice.
There is currently a major new Sustrans programme, Connect2, seeking to promote the development of walking and cycling routes in the UK through targeted infrastructure projects in 79 communities. This provides an opportunity for study of the extent to which levels of walking and cycling, physical activity in general, and carbon emissions actually follow implementation of infrastructural changes. That study[7] is iConnect, which aims (in partnership with several universities and other academic agencies) to integrate public health and transport research perspectives in the measuring, analysing and evaluating these posited linkages.
Three of the project areas (Cardiff, 
Kenilworth, Southampton) were selected for cohort study, with residents living within a five-kilometre radius of these becoming the experimental subjects. Demographic and socioeconomic data were gathered before and after the new infrastructures were opened, along with specific data on travel, car fuel purchasing and physical activity. Potential psychosocial and environmental correlates and mediators of those behaviours were identified. The iConnect study has its own .ac website, which acts as dissemination hub for results as they emerge.
