Who among us hasn’t used Google Earth or Bing Maps (previously Microsoft Virtual Earth) to take a look at our homes, neighbourhoods or interesting structures? From our desktops we have access not just to street maps, but now aerial and satellite imagery, 3D city models and terrain. These services also make it easy to overlay your own data points or layers to highlight concepts. In just the past year or two, such web services have driven incredible awareness and usage geospatial technologies and applications among the general public.
Welcome to the world of GIS: geographic information systems. An oversimplified definition would be ‘plotting data on maps to make it easier to spot patterns or trends’, but that’s just scratching the surface of what fully-fledged GIS systems really do.
Instead, realise that a GIS is a platform for capturing, managing, manipulating and visualising geographic information. This platform technology brings together information from many fields and sciences – physical, social, cultural and design – and integrates the resulting geographical knowledge across disciplines through mapping and modelling of spatial relationships and patterns. GIS is the glue that integrates many different types of data. It allows you to see data on a map and analyse it to reveal patterns, relationships and trends not readily apparent in tabular data. Without GIS it would be almost impossible to collect large volumes of information about observable events, and then build and test theories about patterns and processes. Or, to summarise all this in the words of Steve Kopp, lead software developer for scientific tools at ESRI, ‘GIS is basically creating new data from data you already have. The traditional role of GIS is finding the best place to put something or find something, and very similar techniques also apply to scientific applications.’
GIS has long been used by governments for urban planning and by utilities (for example, where does one place mobile phone antennas to get the best coverage?). In the sciences, GIS is gaining use in diverse areas, examples being global climate change, solar panel placement and efficiency studies, epidemiological studies, oil/gas exploration – and even archeology.
The public face of GIS
The most visible manifestation of GIS is mapping, and this aspect has come to the forefront through free web services. In this regard, consider Google Earth, a service originally called EarthViewer 3D created by Keyhole, which was acquired by Google in 2004. The free version lets you take an aerial view, save locations, and share them with others. Businesses using it for external purposes must license Google Earth Pro, which also allows GIS data import, high-res printing and radius/area measurements. Google Earth Enterprise is intended for organisations with their own large geospatial databases; designed to run on a company’s own servers, it gives an entire organisation access to Google Earth.
While Google Earth has a convenient interface for simple operations, many users automate procedures using the Keyhole Markup Language (KML). This is an XML language maintained by the Open Geospatial Consortium (OGC) and can be used with internet-based 2D maps and 3D Earth browsers from many sources. It is focused on geographic visualisation, including annotation of maps and images. With a few lines of code you can set placemarks, while other KML functions handle ground overlays, paths, and polygons.
Services such as Google Maps provide lowcost, easy access to geographical information – and, in some ways, have redefined the boundary of what GIS is, says David Maguire, pro vice-chancellor at Birmingham City University, and former chief scientist at GIS software house ESRI. Google Maps does simple things simply with low-cost basemaps, through which people can observe the world. He adds that it has brought in a massive user base and sent shockwaves through the GIS industry. However, if Google and Microsoft were to do these things as a standalone company, they’d be broke; instead, they use these services as ‘megamarketing tools’ to drive their other businesses.
Much more than mapping
A commercial GIS system goes much further than allowing you to view points in space; it allows you to give them meaning. GIS provides a framework for gathering and organising spatial data, and for analysing spatial relationships. It consists of three major components: an information system or database; an analytical framework; and a mapping/visualisation component. Maguire draws an analogy to financial software; you can use a spreadsheet program to handle many basic functions, but those who want to do serious enterprise resource planning, customer relationship management, or product lifecycle management turn to packages such as SAP. Similarly, Google Earth and Bing Maps provide basic mapping functions, but for serious work you’ll turn to a commercial GIS package.

This multiple-view image made with Manifold shows Bing Maps satellite data (upper left), calculated digital elevation with the slash showing the San Andreas Fault (lower left), calculated contour lines (middle) and the contours overlaid on Bing Maps image (right).
Even with consumer maps as a background, scientists still need to store and analyse their own data and associate it with other data in a meaningful way. With the heart of a GIS being its database, it’s no surprise that the database supplier Oracle is involved in this field. Some other GIS suppliers use Oracle Spatial for their database, and others interface directly into it.
Just as many applications have date/time as standard datatypes, Oracle Spatial adds 2D and 3D geometry types. With built-in commands you can easily perform a proximity analysis or containment or topology studies as naturally as you can do data arithmetic. An SQL query can determine how far it is from location A to location B and get the results in metres.
Oracle provides all the functionalities of GIS minus visualisation, but has APIs for that task. The firm explains that its open platform complements other GIS technologies, and you can access it from any application level. A chief advantage is the scale factor; the Oracle database is designed for very large datasets, which scientists are generating and that are becoming more widely available.
Johannes Kebek, a Bing Maps technical specialist at Microsoft, agrees to some extent about the place of general-purpose visualisation tools. For simple spatial analysis, in what you might think of as the traditional uses of GIS, he believes that Bing Maps can cover 80 per cent of the applications. This is possible with the help of other tools such as Microsoft SQL Server 2008, which includes spatial datatypes and geometric datatypes, exposes vector and raster data, is compliant with OGC and can read/write GML (Geographical Markup Language) data. But for spatial mining and analysis applications, he agrees that users will need to turn to higher end GIS products.
For some interesting examples of what’s possible with Bing Maps, Kebek first points to the Environmental Atlas of Europe, for which he is credited with the web development, in which the authors visualise evidence of climate changes. Another one is the Worldwide Telescope by Microsoft Research, where you can examine objects in the night sky; Kebek mentions that soon it will be possible to pick a spot on the earth and see a view of the skies in the past and in the future.
Full-featured packages
For high-end GIS tasks, Bing Maps are closely tied into software from ESRI, which includes those maps in its product offering. Indeed, when it comes to full-featured GSI software, most industry observers point to ESRI as the market leader. The company launched its first commercial GIS software in 1982. Today it has 4,500 employees, 300,000 seats and between one and two million estimated users.
The firm’s core product is ArcGIS, which comes with its own spatial database, but also works directly with its own spatial datatypes in an Oracle database (but not Oracle Spatial datatypes). The product ships with approximately 26GB of data, including imagery and basemaps, both public domain and purchased. It has meanwhile built up 30 TB (and growing) of data in ArcGIS Online, some of which is free and some of which is a subscription service that ensures regular updates to the basemaps plus access to higher resolution maps or additions such as meteorological data.
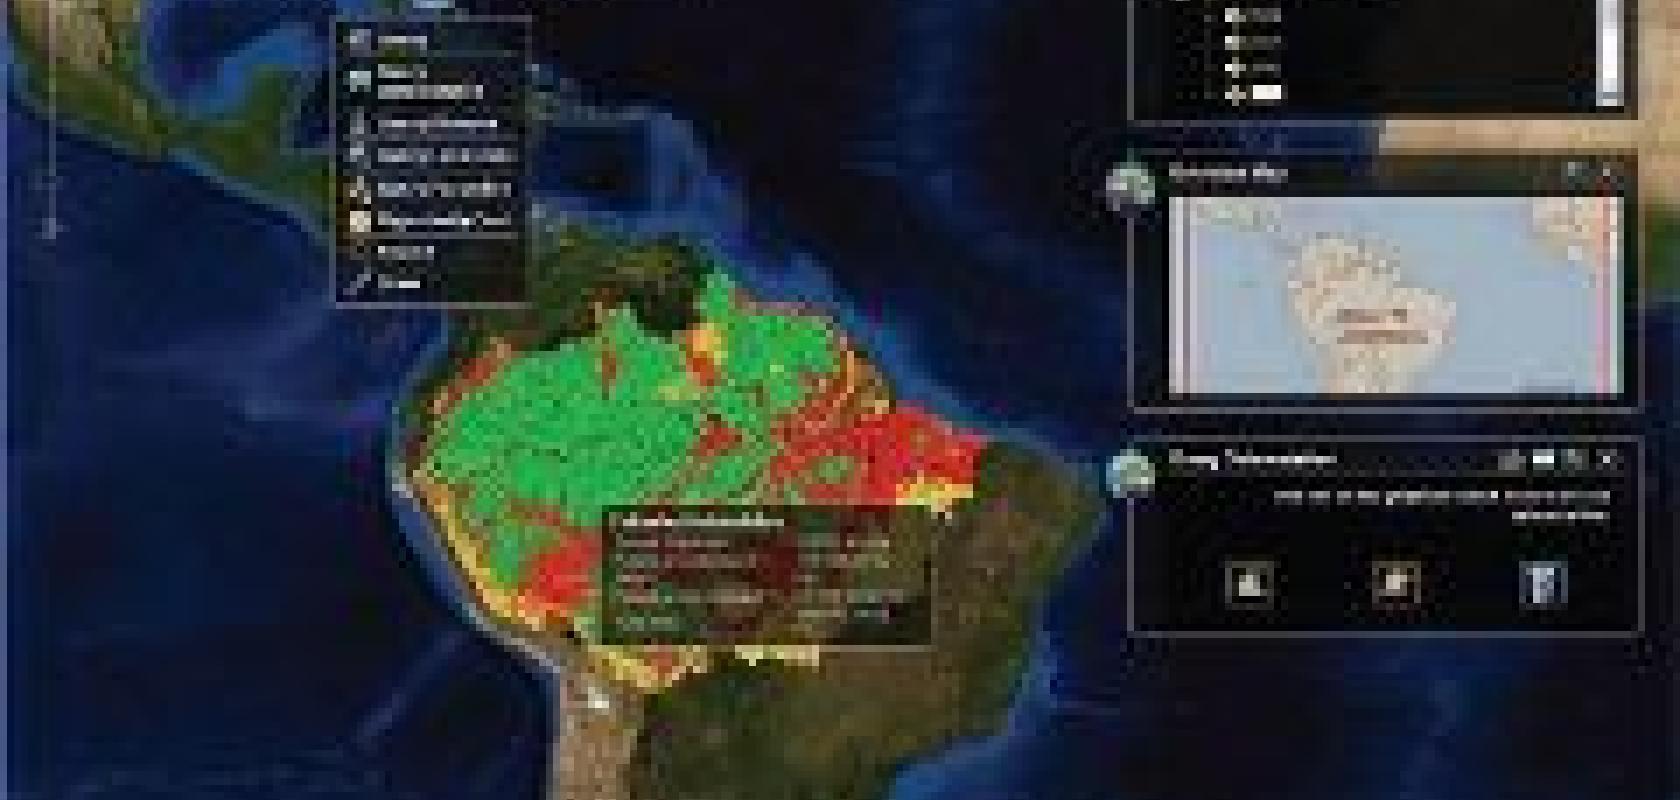
The main module is ArcGIS Desktop, but additional products are available throughout the enterprise on servers and mobile devices, as well as online services and custom applications. ESRI also has a free downloadable geobrowser called ArcGIS Explorer. It is a 3D globe with a built-in map gallery, including Bing Maps, and users can add their own content or connect to additional resources such as geodatabases, layer files or GIS services. It is intended for someone who has domain expertise, but no GIS expertise. In the next couple of months GIS Explorer Online will become available, making this capability accessible directly online. It’s fascinating to see the kinds of GIS applications people in all fields have developed (see [1]). The figure from the Amazon Initiative (see page 32), for example, allows the user to select a region and then it predicts deforestation over time.
Statistical importance
Statistics as a science has also become an important aspect of GIS, and packages such as ArcGIS offer a wide arsenal of tools [2]. Traditional statistics don’t include both space and time, so they don’t tell the entire story. Spatial statistics use area, proximity and direction to identify structure and trends in the data. The nature of geographic data contradicts the basic assumptions of statistical analysis that each observation is equally likely to occur in a sample and that observations don’t influence each other. However, most geographic data exhibits both regional and local trends, so features or values are not equally likely to occur at any location.
Sometimes, drawing conclusions from a map isn’t easy. Statistics tools can cut through the map display and get directly to the patterns and relationships in the data – where is something happening and how widespread is it? Spatial statistics opens up a new set of questions you can answer: how sure are you that the pattern isn’t simply due to a random occurrence? To what extent does the value of a feature depend on the values of surrounding features? How well does the value of one attribute predict the value of another? What are the trends?
Another aspect of the IT part of GIS is transforming GIS information from one state to another. Examples are reprojections, raster/vector conversions and polygon overlays, but in any such transformation information is lost. The fitness for purpose of information can only be determined if the history of the information is known or if appropriate measures of accuracy are recorded.
Looking for differentiators
Besides ESRI, there are a number of other suppliers of GIS software. Given the dominance of ESRI, these companies generally focus on niche markets such as utilities or telecom applications or are addressing the market by driving down prices.

An Oracle Spatial mapping of the KEGG Pathway database.
One of the very first desktop GIS packages came from MapInfo, which was acquired in 2007 and now operates under the name Pitney Bowes Business Insight. The firm specialises in commercial applications in what it calls location intelligence to help companies identify growth opportunities, such as choosing profitable locations for expansion and streamlining delivery routes.
Very aggressive with pricing is Manifold, whose base package costs $295; the Professional Edition adds IMS (internet map service), while the Enterprise Edition adds spatial DBMS capability. Product manager Dimitri Rotow explains that Manifold is an integrated system with its own database, and he compares it to combining a database program with Illustrator, AutoCAD, Excel, Visual Studio and a web facility, all with a slant on GIS functionality. You can think of it as a ‘word processor for maps’ for creating new maps or editing existing ones; meanwhile, it’s also a ‘database system for maps’, so a map can be used as a visual interface into a large dataset.
Besides price, another interesting aspect of Manifold is that it’s the first GIS product to leverage the speed of GPGPUs from Nvidia. The current release of Manifold provides almost three dozen CUDA-enabled functions for computations within the optional Surface Tools extension. Rostow reports that with the CUDA configuration, calculations that previously took 20 minutes are now done in 30 seconds, and calculations that previously took 30 to 40 seconds are now real-time.
One reason for the increasing complexity of GIS datasets that can benefit from GPU acceleration is that massive amounts of data are being collected and made available, and more detailed analysis is required. Satellite photos once available only to intelligence analysts are now viewable by anyone with an internet connection. In addition, satellites now image the Earth using multiple sensors that collect data in multiple wavelengths and resolutions and from many different angles. Without GPU acceleration, adds Rostov, GIS users would need to settle for lower-resolution data, which can miss subtle terrain artifacts – for an archaeologist, for example, this lower resolution could mean finding the outline of a buried fortress, but not the individual walls, making a dig problematic and costly.
Within the GIS area, users can also choose from many open-source packages. Professor Maguire suggests GRASS (Geographic Resources Analysis Support System). Developed by the US Army, it has evolved into a utility with a wide range of applications in scientific research. GRASS contains more than 350 utilities and tools to render maps and images; manipulate raster, vector, and site data; process multi spectral image data; and create, manage, and store spatial data. It has both a command line and a graphical user interface.
Unconventional maps, too
Maps based on spatial data need not be geographically related. Oracle Spatial product manager Xavier Lopez notes that it has broken boundaries with traditional GIS technologies, and that the product is not limited to earth mappings. You can also work with nongeographical systems, whether it be celestial or cellular mapping, or biological pathway analysis as in the figure, above left. It is an Oracle Spatial mapping of the KEGG Pathway database, which is a collection of maps representing molecular pathways for metabolism, genetic information processing, environmental information processing, other cellular processes, human diseases and drug development. This bioinformatics resource is part of projects of the Kanehisa Laboratories in the Bioinformatics Center of Kyoto University and the Human Genome Center of the University of Tokyo.
1. A sampling of user-submitted GIS applications: www.esri.com/software/arcgis/arcgiasserver/live-user-sites.html
2. Mitchell, A., The ESRI Guide to GIS Analysis Volume 2: Spatial Measurements and Statistics, ESRI Press, 2009.
