
Like any regulated industry within the food and drink sector, breweries must collect, analyse and manage data from their R&D, quality and manufacturing processes.
But dedicated brewery management systems often don’t have the capacity to handle data from laboratory–based quality or other testing workflows, suggests John Boother, company chairman at Autoscribe Informatics. ‘Brewery management software is commonly centred on customer relationship management (CRM) activities, invoicing, ordering and inventory, and perhaps accounting, as well as other key activities including cask management. What they don’t, as a rule, provide is any scope for managing quality control testing and resulting data and reporting.’
Yet quality testing is critical at multiple stages throughout the brewery process, and is an imperative to satisfy regulatory requirements, Boother continues: ‘There are five fundamental areas where quality checking is carried out. The first is goods in, which means logging and testing the raw materials as they arrive at the brewery, before they are released into the brewing process. Multiple samples may then be taken for laboratory analysis at a number of different stages in the brewhouse, where ingredients are mixed and fermentation takes place.
‘Beer that comes out of the brewhouse is subsequently stored in the cellar, or cold process area, where there will be another cycle of finished product testing. And associated with that there may well be shelf-life analyses, so that the product can be labelled correctly in its cans or bottles with a best-before date. Two other areas that can fit, broadly, into laboratory activities are sensory testing of the beer to evaluate taste and smell, and testing of the final product packaging to make sure that all the labelling is correct.’
All of these areas of testing are effectively forms of quality examination, Boother suggests. ‘A sample is taken, the test is carried out, the results are compared against limits for that particular product line, and then are validated by a supervisor before being approved so that the final product can be released for distribution.’
Importantly, these requirements don’t lessen if you are a small, start-up or microbrewery: ‘Micro- and craft breweries are a growth industry, and so the requirement for software that can manage ingredients, product and quality testing can only increase.’
Quality testing
So why, if so much testing has to be carried out as a matter of course, don’t brewery management packages include, as standard, the capacity to manage quality-related testing and data? Managing laboratory processes and results is a harder technical nut to crack than managing customer contacts, inventory, and costs, which are largely administrative functions, Boother believes: ‘Quality testing involves traceability, scheduling, regulatory compliance and reporting. Building the capability to handle those workflows, and manage and analyse resulting chemical data, operating parameters and limits into software requires specialist expertise.’
In Autoscribe’s experience, while breweries are now increasingly trying to manage all their laboratory processes in-house, many still outsource their samples to contract laboratories, and so don’t view testing as key activities that need to be central to their informatics infrastructure. ‘The laboratory is also not a profit centre, so investing in specialist software to manage testing processes may not have been a priority. But with increasing regulatory oversight and requirements throughout the food and beverage sector, including breweries, the industry is now starting to consider how best to manage, streamline and provide transparency for their laboratory functions.’
Autoscribe’s Matrix Gemini LIMS can be easily configured as a fully functioning brewery management solution that can also manage all the brewery’s testing and other quality-related activities, Boother states. ‘We have had increasing interest from the industry and have configured Matrix Gemini for brewery clients. Although the software is aimed foremost at laboratory management it can easily extend out into other areas of process management.
‘Matrix Gemini can link into a dedicated CRM, and interface with accounting packages. Functions such as cask tracking and management can also easily be configured within the inventory control functionality within the LIMS. Importantly, we change the look and feel of our software and how it works, to meet the customer processes. The system is highly configurable, so we sit down with the brewery and map their requirements into Matrix Gemini so that the software fits their requirements, workflows and processes.’
K&G Data Solutions has developed Brew-Q to address the brewery industry’s call for a user-friendly, easily configurable software for collecting, analysing and reporting on everyday quality data, tests and results. A cloud-based, monthly subscription service, Brew-Q is a stand-alone platform on which breweries can collect and collate all their quality-related data, view and report data using a range of text and graphical formats, and meet regulatory reporting requirements.
‘We found that many breweries, including, perhaps surprisingly, some of the larger companies, were still using excel sheets for managing and reporting their quality data,’ explains Fletcher Keil, co-founder at K&G Data Solutions. ‘However, reporting using Excel or similar document-based approaches, offers no traceability. We developed Brew-Q as user-friendly software that would provide breweries with a platform on which they could log, analyse, report and trace all their quality-related information.’
Brew-Q isn’t a LIMS or all-in-one brewery management software, Keil stresses: ‘Some of the breweries that already have a deployed LIMS were telling us that they were having to pigeonhole brewery-specific requirements into informatics platforms that weren’t developed for their needs, and were very hard to customise. On the other hand, some of the smaller, craft brewers just wanted a software through which they could capture, report, trace and compare day-to-day quality-related activities and tests.’
Ease of use and flexibility are key features of Brew-Q, and the software can be installed and configured within a day, Keil stresses. ‘Customers can easily create their own Brew-Q database and customised functionality. User-specific, customiseable dashboards make Brew-Q inherently user-friendly and easy to fine tune for different brewery departments. Quality data can be entered using a mobile or tablet.’
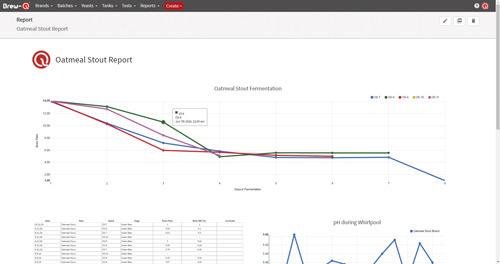
The ability to add, remove and edit different brews and brands in production, adjust and set alerts for test result and limits at different brewing stages, means that the software can also easily keep up with multiple, or changing processes, and ensure that anomalous data and results are flagged up automatically. ‘The Reporting module then makes it easy for users to create detailed reports and charts, including fermentation graphs, pH logs and sampling, either using a template within Brew-Q, or by creating their own,’ Keil adds.
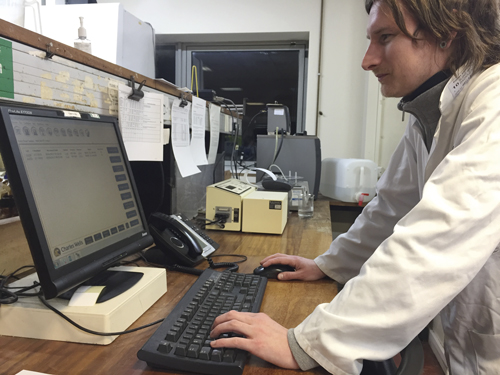
A Charles Wells lab technician using LabWare LIMS
More functionality
Launched about 14 months ago after three to four years of development, Brew-Q is constantly evolving. ‘We have developed the software entirely on the back of requests from breweries, including large, industrial-scale operations and small, craft brewers. We are pushing out updates every two weeks or so, all of which we are developing in response to customers’ needs.’
Customers are also requesting additional functionality within Brew-Q, Keil states. ‘Our customers really like the user interface, and the ease of customisation of Brew-Q, and they are asking to expand application of Brew-Q into other areas of the brewery. Some customers want to keep their quality, production and accounting processes separate, but others are more interested in having all this information in one place. So we are developing optional modules that can manage things like inventory and recipe tracking, and production planning, which are outside of quality testing. We are also expanding reporting capabilities.’
Brew-Q doesn’t connect with analytical instrumentation, because that’s not what customers have been asking for, at least not so far, Keil continues. ‘We are certainly not averse to the idea, and this remains a possibility for the future. We have talked with clients about the possibility of connecting with instrumentation directly. Some of the larger breweries already have instrument-interfacing LIMS in place, but are finding the complexity of configuration problematic, so they have been looking for software they can use as a database and reporting tool for laboratory data. Some of the smaller, craft breweries don’t have the setup or resources to establish a complex quality lab, and they just want a software that would give them the recording, analysing and reporting options outside of excel sheets and written down logs.’
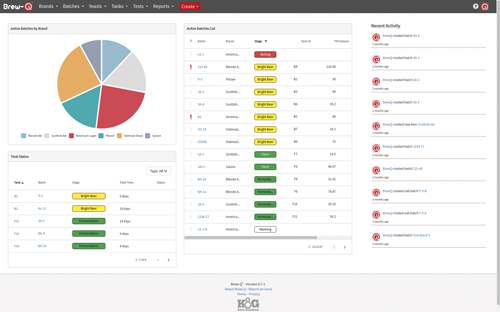
Brew-Q dashboard and reporting capabilities
Increasing automation
LabWare has been working with breweries since the first release of LabWare LIMS, notes John Gabathuler, director, industrial and environmental. ‘The LabWare LIMS and Electronic Laboratory Notebook (ELN) enterprise platform offer breweries the configurability and functionality that they require for their manufacturing requirements, R&D, routine and ad hoc testing, along with interfacing capabilities to instrumentation, ERP, SCADA, and other processing automation, increasing innovation, speedit, retrieval and analysis, and presenting information and data in required formats and dashboards improves traceability and compliance, whilst reducing errors. Increasing automation, and reducing steps and checks in between processes also equates to seamless processing.’
Charles Wells Brewery installed LabWare LIMS in June 2012, ‘to replace a legacy system that didn’t have the functionality, flexibility or configurability to match the brewery’s needs,’ explains Paul Warren, quality systems analyst. Prior to the LIMS, any regular analysis and monitoring of key beer quality and consistency measures such as ABV, colour, and bitterness had to be carried out by sifting through large quantities of written data. ‘Forming any kind of report so product consistency could be monitored and parameters adjusted accordingly was a hugely time-consuming exercise.’
In contrast, the LabWare LIMS automatically analyses key parameters and generates a report twice weekly, so recipes and blends can be adjusted. The lab technicians carry out the analyses on beer samples and input the data directly into the LIMS, Warren explains: ‘The LIMS generates charts so we can see what the trends are; this gives us the information we need to make tweaks and ensure product consistency and quality. Importantly, the LIMS also automatically generates key regulatory reports, including monthly reporting of alcohol volume and cask sedimentation, for HMRC, a task which used to take days to complete. We package beer for a number of other breweries, and we also now have a standard template we use to provide all of our contract package customers with the data they will need for their own alcohol monitoring reports.’
Charles Wells is now in the process of interfacing the LIMS with a new supervisory control and data acquisition (SCADA) system, through which processes will be controlled and data automatically acquired.
The LabWare LIMS is far more than just a reporting tool, however, and has been rolled out across the brewery. The platform now manages data associated with every aspect of laboratory work, including microbiology testing, and just about all sample and process data throughout the brewery, from yeast strain management, to fermentation in the brewhouse and beer in bright beer tanks, as well as final packaging. ‘The LIMS means we can trace progress of the ingredients, products and processes from reception through to packaging, which is a hugely important factor for us.’
Automatic alerts mean that out-of-specification data can’t slip through the net, Warren adds: ‘An individual putting data into the old system would have to cross-check their data against specifications in a paper manual. There was plenty of room for error if they checked the wrong specification, or forgot to check a specification. The potential for this kind of error has now been removed, because results are automatically checked against specifications stored in the LIMS.
‘If there is a need for corrective measures to bring a parameter – and therefore product quality – back within its accepted limits, the operator responsible will have to implement those measures, or explain why not, while an exception report is generated and automatically sent to the relevant personnel to check before the beer is released for packaging.’
Charles Wells is unusual in that it also brews or packages beer for others, ranging from smaller regionals to larger national or multinational brewers, Warren explains. ‘We may be brewing up to 30 different beers on site at any time, and package into casks, kegs, bottles and cans. The LIMS enables brewery staff to follow each beer or brew through its cycle.’
Similarly, the system has made a huge difference to stocktaking and production planning, says Warren. ‘Before we installed LabWare LIMS we had only a very low-tech method of recording where and how much of each beer there was in the brewery. Stocktaking was a matter of someone walking the site, making a note of the paper tag placed on each tank to say what it contained on that day, and then checking the volumes and updating a spreadsheet. All beer movement information is now entered in the LIMS in near real time, which makes it much easier for us to plan production.’
Go configure
Although LabWare LIMS is laboratory-focused, the ease of configuration and interfacing of the LIMS and ELN with other software systems within the brewery makes it a key part of the firm’s business systems, Gabathuler says. ‘Using LabWare LIMS, breweries can manage everything from raw materials reception and checking through to final product and packaging control. The scalability of the system provides for sample tracking, storage location management and capacity across multiple sites.
‘Once trained, customers can quickly gain skills to configure the system to meet different, or changing business requirements, without having to rely on us as the vendor. Our customers will typically gain full ownership of the system in terms of being able to readily adapt it make it fit their processes and business needs.’