A common sight in factories and other industrial settings in the past might have been of a technician with a pen and clipboard, noting down measurements from assorted pieces of equipment to ensure that everything was running properly. Today, however, a computer is far more likely to be gathering measurements such as temperature and pressure automatically and alerting the technician of anything that they need to be aware of.
A similar evolution is occurring in the research environment. Many observations that scientists would previously have written in their notebooks are now being collected by computers. And it is not just routine pH or voltage measurements. The power of modern computing, combined with developments in instrument technology, is enabling millions of pieces of data to be collected in seconds, whether from automotive crash tests or the effects of an earthquake.
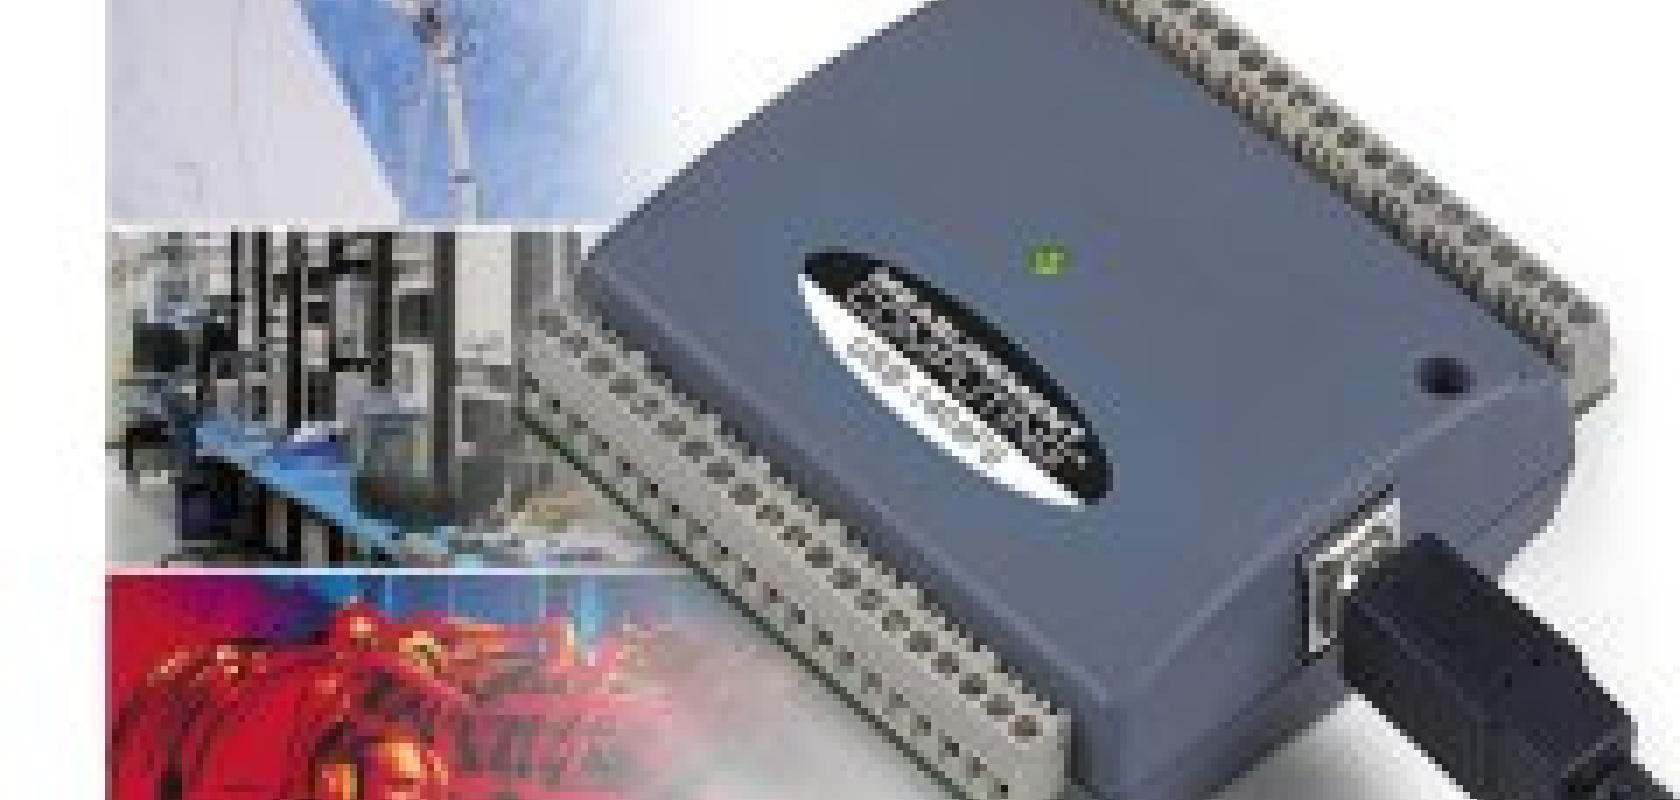
All the instruments involved produce analogue signals initially, with the inevitable accompaniment of varying levels of noise. Data acquisition hardware, whether internal to the instrument or purchased separately, is required to convert those analogue signals into digital data and transfer that data to a PC. There, data acquisition software takes over and carries out initial analysis or converts the data into a form in which it can be handled in other data analysis packages or added to reports. With several stages and many companies involved, the challenges of integration and standardisation are inevitable.
From instrument to PC
For many, the first few steps of taking the analogue signals from the wide range of possible instruments and getting the resulting data into the data acquisition software pose some of the biggest challenges. To start with, there are the varying instrument types, from simple temperature sensors up to multi-million pound synchrotrons, which all generate data that must be acquired and analysed. These instruments might be common off-the-shelf equipment, specially customised commercial products or even purpose-built instruments that are, perhaps, unique to the laboratory that made them.
Then there is the issue of a wide range of signal type and quality. ‘Signal conditioning is a challenge,’ says Martin Krebs, technical sales specialist for data acquisition at Adept Scientific. ‘For example, a strain gauge shows a very small resistance change level that requires amplification and must be very well conditioned to prevent noise problems.’
Once these analogue signals have been converted into digital information the next challenge is getting this information onto a computer. One of the first decisions here is the choice of the interface, network connection or bus. Approaches to achieving this include RS232-compliant serial ports; PC cards; Compact Flash cards for PDAs; Ethernet; or the IEEE-488 bus (or General Purpose Interface Bus – GPIB). There are also a wide range of other industry-specific buses. ‘A few years ago industry tried to standardise on field buses, but standards efforts are limited because different applications require different data acquisition speeds,’ says Krebs. ‘Standardisation must be possible, but it’s difficult on the technical level and might be quite restrictive on new development.’
To overcome this problem Krebs recommends a data acquisition application called DASYLab (from National Instruments). ‘This package is designed to be compatible with hardware from a wide range of manufacturers, including many smaller, more specialist vendors. DASYLab also supports any instruments that communicate with industry standard protocols, such as GPIB, CAN (an automotive standard), MODBUS and OPC,’ he explains.
The ability of this software to work with different interfaces is likely to continue to be important as more approaches gain popularity. A recent trend is towards USB connections, and this is rapidly becoming favoured by many users. But even this is not simple. ‘You still can’t buy any device and know that it will work with your software,’ explains Krebs. ‘You often still need to install the vendors’ USB drivers.’
In addition, wireless interfaces, based on technologies such as Bluetooth and WiFi, are starting to be supported by manufacturers. ‘For data acquisition the future trend is wireless,’ predicts Russell Sion of C-Cubed. ‘RS232 can be adapted for wireless with tools such as the RS232 cable to Bluetooth converter from Brainbox.’
‘We would like instrument manufacturers to come out with standard connections,’ says Mike DeWitte, who is vice president of sales and marketing for Labtronics. However, he adds: ‘Collaboration has been tried and tried again, but it really doesn’t work. There are so many manufacturers and so many standards.’
The way of communicating data is complicated further by additional protocols in some applications. For example, the healthcare industry has a protocol to ensure that data measurements from instruments are actually received by the host computer and handled properly. This is particularly important in the healthcare sector, because the data corresponds to patients and their treatment.
Data formats vary
What’s more, all these interface decisions still leave the format of the actual data up for debate and inevitably there is more than one approach to this too. Most instruments have their own data formats, which they may or may not share with third parties. If these formats remain proprietary, this forces customers to use data acquisition hardware and software from the instrument manufacturer.
‘Proprietary is a way of getting the end user to the point where they don’t have the choice about how to do their work,’ comments John Rogers, an electronics engineers at DAQ Systems, which builds instruments, data loggers and accompanying software for seismology. He says that his company supports a range of seismology data formats, but only those that have been published. Despite this restriction about using published formats and the fact that seismology is a fairly narrow subset of science and engineering, his company still has to support at least six different data formats.
One of those seismology data formats is the Standard for the Exchange of Earthquake Data (SEED), which has been adopted by the US Federation of Digital Seismographic Networks (FDSN). According to this standard’s documentation, ‘data exchange has been complicated by different data logger formats, by different computer systems, and by incompatible exchange media. One cannot use, or even visually examine digital data without extensive processing with additional computer hardware and software… Seismologists around the world … have recognised the need for a seismic data exchange standard … but none has succeeded in creating a de facto standard.’
This situation is replicated in most industries. ‘There is a jungle of different formats,’ agrees Ivans Vins, product manager of DataApex. ‘It is very frustrating for users, because they need to find compatible hardware and software.’
Proprietary can have benefits
However, proprietary communications protocols are not always simply about manufacturers keeping a stranglehold on their customers. As DataApex’s Vins points out about the pharmaceutical industry, which his company serves with chromatographic software: ‘Sometimes it is necessary to keep it proprietary. The FDA requires that the raw data should not be modifiable during processing. This is the reason that most chromatographic software uses proprietary data formats,’ he says. ‘If people knew the format of the raw data then they could easily modify it. It is easier to just erase a small impurity peak in a chromatogram than to re-measure or re-make the sample.’
So how do data acquisition software packages deal with the issue of multiple data formats? The answer is to go for the simplest way possible – transmitting data as ASCII codes. All software is able to accept and output data in this format provided the communication protocols are known and it is generally regarded as the best way to handle the wild diversity of possible formats. ‘Most programs read ASCII. At the end of the day you could always use that format,’ comments John Rogers of DAQ Systems.
However, ASCII files do have limitations, especially when it comes to file size. Some experiments generate huge amounts of data. As ASCII files store data as text, and are not compressed, such data sets occupy considerable disk space and require a high-bandwidth connection. ‘In a text-based format each digit is represented by an eight-digit number. In contrast, binary formats represent the whole number in one binary number with other information such as date, time and what the data is at the top of the file format or with each piece of data,’ explains Adept’s Krebs. Because of this advantage there are many proprietary compressed formats from different manufacturers.
Another emerging approach is to use web-based formats such as XML. ‘Web services are becoming more accepted. Theoretically you don’t have to install any software because you already have the web software,’ says Krebs. However, this is not enough in itself, believes Mike DeWitte of Labtronics. ‘Some instruments put data into a web page but that’s all. What’s the use of that? It doesn’t make sense unless you can actually do something with the data,’ he says.
Nonetheless, the simple ASCII approach is generally preferred as it can be used by any software, provided that the instrument manufacturers make their communication protocols known. An example of this is the Collect software from Labtronics, which uses a parser to segment raw data and enable users to export the pieces they are interested in into their analysis program. ‘Collect works with ASCII, says DeWitte. ‘It does not currently work with binary or hexadecimal data, although we do get requests for that from time to time.’ The answer, he says, to high data transmission rates is to transmit the data in a binary format and let the computer translate the data using third-party conversion tools.
From acquisition to analysis
The range of formats and approaches is echoed in the outputs of the data acquisition software although, with Windows and Microsoft packages such as Excel being so ubiquitous, the PC end of the chain is simpler to some extent. ‘The most universal format is probably to export it onto PC into something like Excel. Then you can start to standardise,’ says Adept’s Krebs.
However, it is not always quite that straightforward, because not everybody wants to, or even can, analyse their data using something generic like Excel. Specialist applications often require specialist analysis tools, which are likely to have their own data formats. Furthermore, many data acquisition packages include analysis capabilities so that the output to something like Excel or Word, if at all, comes at a much later stage.
‘LabView [from National Instruments] has evolved a lot of analysis capability so customers tend to do much of their analysis within it and avoid too many data export issues,’ says Ian Bell, of National Instruments. ‘However, some people need to use packages such as Excel, Matlab or mass spectrometry software. There is no one data standard across the industries.’ He adds that LabView is a programming language so can output into any data format and some maths packages, such as Mathematica, also have add-ons to interface with LabView.
Nonetheless, this variety of possible outputs means that the simplest file formats are often favoured, usually with comma or tab-separated text files, such as CSV files. However, there are limits here too, according to Bell. ‘With CSV files it is very hard to move around large sets of data or to search through them,’ he says. In addition, there are variations in implementation. ‘Everybody who uses CSV will come up with their own data format. We’ve come across companies that, for very good reasons, have changed their CSV file formats (such as changed the order of their data or even just moved a comma) and ended up repeating experiments rather than trying to interpret old formats.’
National Instruments’ response has been to come up with its own format developed with data mining in mind. ‘The TDM format is open, but it imposes some structure on the data so that, for example, the channel names or dates will always be in the same position within the data,’ explains Bell. ‘It is difficult to see one single standard emerging that is going to address everybody’s needs. The nearest that we’ve seen is our own standard, because it is generic – used anywhere from the automotive industry to research laboratories.’
PCs face challenges too
A final challenge emerges with the host computers themselves. Processor manufacturers have reached the limits of the power increases possible with a single processor and are turning to multi-processor systems. ‘Code that was designed for one processor won’t necessarily realise the benefits of speed increases,’ explains Bell. He believes that LabView has an advantage, because it is a graphical language that was written to partition processing. However, he says that this is more difficult with text-based approaches.
These challenges will have to be addressed, because once the speed of the computers is increased, their use in data acquisition will inevitably increase too. This means more data being generated and more work for data acquisition companies to do to manage and analyse this data – in whatever format it is in.
