Image analysis covers a lot of territory, these days. From astronomy to microbiology, if there is a field of study which remains immune then I haven’t found it. Some of the glamorously obvious applications which it underpins are in biometrics, where it is used in fingerprint readers and facial recognition systems touched upon in last year’s pattern recognition article [1], but it is just as important to the routine application of science. Many of the medical, climatological and military visualisation examples which I quoted in the last issue [2] have image analysis as their raison d’être.
The ActivityBase XE package from IDBS illustrates both points, combining high volume data checking with biopharma compound screening. It also illustrates the fallacy of assuming that image analysis is necessarily concerned with a primary lens-based visual image as it takes its place in a chain of analytic steps.
Organon, the human health arm of Dutch-based Akzo Nobel, has recently installed XE release 6 in its European (Netherlands and Scotland) research centres as part of microplate reader quality management. A microplate reader, in itself, employs some level of image analysis to remove a layer of human subjectivity from the evaluation of results. Microtiter plate well contents are visually coded (by density, colour or fluorescence) to make a relevant reaction susceptible to machine vision or other optical processing techniques that feed out resultant data for further handling. XE extends this by examining the reader data for anomalies and error types and feeding back visualised reports where necessary for human checking.
The benefit to Organon is a faster, more objective validation of its experimental data flow, enabling a more efficient, reliable and rapid compilation of the results database.
A similar story is told by Acumen Pharmaceuticals, a California biotech company researching memory-related disorders such as Alzheimer’s disease. Image analysis here is handled by Thermo Fisher’s Cellomics sandwiched between Plate Manager and Assay Explorer, both Elsevier MDL.
Acumen and Organon are large concerns with installed plate readers and existing workflow structure into which image analysis must link. As in other areas of the computing market, however, hardware and software are often packaged into one-stop solutions.
While writing this, I visited a marine laboratory central to a substantial regional project combining ecological conservation with economic regeneration. The whole operation is run using PAX-it software. Offered as part of a package by PAXcam with their eponymous range of digital microscopy cameras, PAX-it is a modular software environment, the digital microscopy equivalent of an office suite, providing short learning curve functions across most small user requirements from stage control to image library management. 
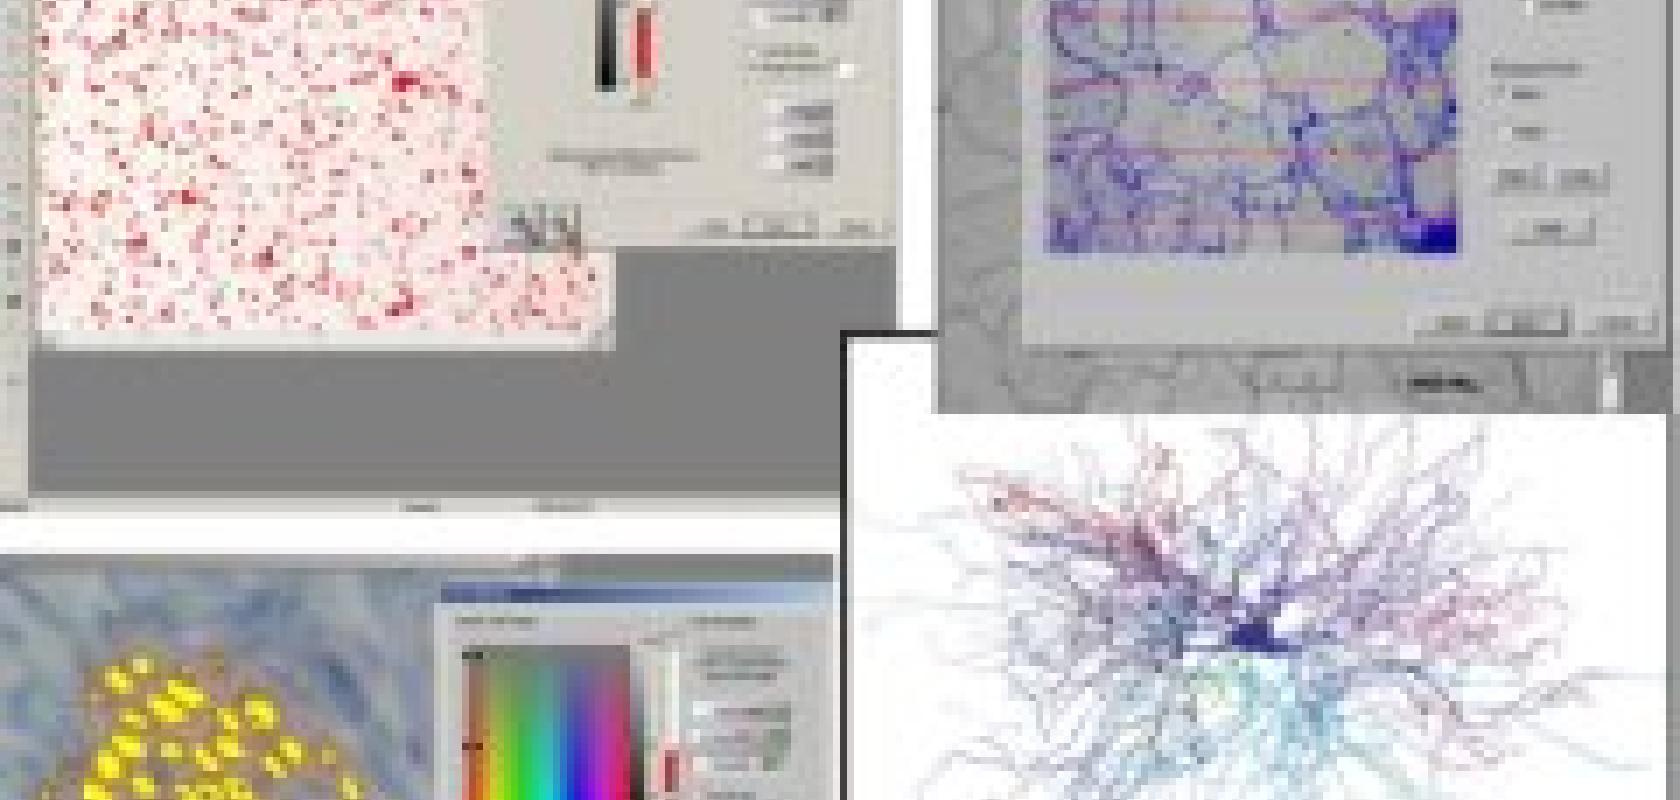
A Neurolucida image (bottom right) joins three PAX-it views including morphometry (bottom left) and particle sizing (top right)
Staying with microscopy, a more specialised example of the integrated approach is Neurolucida from MDF Bioscience, designed specifically, as the name suggests, for neural work. Many areas of data acquisition, from volumetric analysis of live digital video feeds down to 3D control of the microscope stage, can be taken over by the software.
At the other end of the scale, astronomy depends very heavily on image processing and analysis. Image processing is a separate, but functionally related, area – analysis frequently relying on preprocessing to provide suitable material. Astronomy these days makes very little use of the visible spectrum, so false colour visualisations for human inspection are a common starting point.
As with some microscopy, resulting images usually contain vast amounts of data, which computerised analysis can sift down to manageable proportions far more rapidly, reliably and efficiently than the human eye – and without fatigue. At the lowest level, software can very quickly catalogue individual objects within a star field by magnitude, colour or some other such criterion against position, generating a database from which subjects or classes can be selected for closer attention – an astrobiology or SETI program perhaps seeking objects in the vicinity of 5750°K.
Larger objects such as galaxies and clusters can be measured and classified by visual morphology, spectral structure, or otherwise. Images formed by different means, or in different wavelength bands, can also be compared, overlaid, or subjected to combinative processes. Astronomy, perhaps more than any other field, demonstrates the particular advantage of image analysis for high data volumes.
They can be raided for a small and immediately useful variables subset first, revisited as many times as is useful, and later combine with new images of the same data space or another, possibly using new imaging techniques. Every pass through the information stored within the image is added to a database. By scanning in archive analogue material, difference data can be extracted from comparison with images dating back at least half a century. Between cell and stars, a widespread and well developed use of image analysis, and the original cradle of many techniques applied in other areas, is in geospatial surveying.
Climate, land use, petroleum prospecting, migration patterns, battlefield management, forestry, oceanography, military or industrial intelligence gathering, epidemiological transmission vector analysis – the scope for analysis of aerial or orbital imagery is seemingly limitless. ESRI, which supplies the widely used ArcView GIS (geographic information systems) software, also offers an ArcView Image Analysis product designed for use at the individual level.
A herpetological acquaintance is tracking distribution of tortoise populations in stressed and changing environments. This touches on a historical research interest of mine, so I invited myself along for a look at his data and methods and discovered another example of the richness offered by image analysis. His images are drawn from a diverse range of sources, including 80mm negatives languishing in an oil company basement since an unproductive low-level aerial survey in 1937, and digital military police pursuit video footage less than a month old.
As with astronomy, this sort of work demonstrates the ability of imagery to capture data not immediately used, needed or recognised and preserve it for future extraction. Using ArcView Image Analysis, he is single-handedly stitching together a longitudinal picture of shifting patterns cross-related to GPS placement and external data. Tortoises are spotted with a rapidity, certainty and geographic extent that would have been unimaginable in my days of manual visual inspection.
Nor is image analysis necessarily the sole preserve of large projects with automated image capture capacity. In a small Middle East farming community where crop blight is damaging health, the doctor and two nurses at a clinic use a laptop to analyse foliage photographs taken by primary school children across the district.
With such omnipresence, image analysis and associated processing have inevitably attracted the attention not only of specialised developers but of generic analytic software as well. Wolfram, The Mathworks, Maplesoft, and PTC all offer explicit image processing and analysis extensions for Mathematica, Matlab, Maple and Mathcad respectively, as well as the background tools, such as wavelet packages.
Whether to use specifically designed image analytic products or grow bespoke methods from generic building blocks is, as always, a trade off. Established products offer convenience and the reassurance of debugging already done; growing our own offers flexibility and perfect fit to purpose. Whatever the method, the principles remain the same and the potential equally extensive.
What is image analysis?
Essentially, image analysis is simply data analysis with the initial raw data stored in a spatially referenced array. The array is usually thought of as representing a two-dimensional, lens-based visual record, though this isn’t necessarily so. Reading a bar code is the frequently given bottom-end example of a one dimensional image designed for analysis.
There are 3D array applications based on holographic surface scans, sampled and tomographically scanned volumes, or both. Between those extremes come examples such as OCR (optical character recognition) and the more complex automatic handwriting recognition. Handwriting recognition provides a convenient illustration of the difference.
Handwriting captured from paper forms, cheques, notebooks, etc is, essentially, a photograph. The image to be analysed is a two-dimensional array of points with (x,y) Cartesian coordinates and usually one, three or four associated variables representing colours and/or grey scale luminance. From an analytic viewpoint, each data point within the array starts out value neutral: it may be part of the signal (a handwritten pen stroke), background noise (paper texture, for example, or damage, or material showing through from the other side of the page), or some mixture of both (where a handwritten stroke crosses a grease spot, perhaps).
Handwriting entered through a digitiser pad (whether on a PDA or through a graphics tablet attached to a larger system) is different. It comes in as a time series, again with (x,y) coordinates and possibly with a pressure level variable. The second case makes for dramatically simpler analysis.
Recognition software faced with the first case starts by trying to simplify the task. When I feed a cheque into the deposit machine at my bank I am asked to insert the amount box first. The software can first seek the outline of that box and ignore everything outside it. Within the box, it can assume that there will be no alphabetic characters, only digits and a limited number of other marks (currency symbol or decimal separator as either dot or dashes).
References
Grant, F., Scientific Computing World, 'Recognising the future'.2006(July 2006). Available from: www.scientific-computing.com/features/feature.php?feature_id=3.
Grant, F., Scientific Computing World, ‘If a picture paints a thousand words’.2007(February/March 2007).Available from: www.scientific-computing.com/features/feature.php?feature_id=150.
Fischler, M.A. and R.C. Bolles, Communications of the Association for Computing Machinery, ‘Random Sample Consensus: A Paradigm for Model Fitting with Applications to Image Analysis and Automated Cartography’.1981. 24(6): p. 381-395.Available from: www.ai.sri.com/pubs/files/836.pdf.
Brown, M. and D. Lowe (2006) Automatic Panoramic Image Stitching using Invariant Features. www.cs.ubc.ca/~mbrown/ papers/ijcv2006.pdf
The Random Sample Consensus (RanSaC, or RANSAC) paradigm, introduced by Fischer and Bolles in 1981 [3], is the basis for many algorithms underlying the integration of images which differ in orientation, perspective, and other respects – a problem frequently encountered in analyses based on multiple or fragmentary sources, and especially when using archival material from image stores not originally intended for direct analysis
In principle, RanSaC is concerned with sophisticated elimination of outliers, but in their original article the authors concentrate on application in the ‘Location Determination Problem’ – finding the spatial coordinates of the viewpoint from which an image was generated, given the coordinates of ‘landmark’ points within the image.
This has since been developed in various ways, including harmonisation of omnidirectional camera images, the potential of which are neatly illustrated by Autostitch from Matthew Brown at the University of British Columbia – Automatic Panoramic Image Stitching using Invariant Feature [4] is recommended reading.
The process is a progressive one. A suitable object recognition algorithm (such as David Lowe’s SIFT operator) is used to locate suitable recognition points in two images. RanSaC is used to establish homography between the images by randomly sampling points to seek those which maximise inliers and minimise outliers. Once the homography has been established, images can be transformed to bring correspondent points into the same geometry.
Other aspects of the images, such as colour and tonal scales, can also then be harmonised and the image pair merged at their correspondent points to produce one new file. Another pair of images is then selected and the process repeated until all input files have been processed to produce a single output.
Some examples can be seen in the accompanying illustrations.
Using RanSaC-based methods, a mosaic of photographs showing details of a foreshore study area 9of which only four examples are shown in the upper half of the frame) are rotated, resized, adjusted for luminance and gamma, and assembled to produce the single image below.
