The application of skills from the mathematical physics branch of science to finance and economics has become firmly established. By the late 1990s, physics graduates were being vigorously recruited by finance houses. As I write this, the Securities and Investment Institute’s Career Centre is advertising for ‘incredibly bright mathematics/ physics graduates (MSc/PhD preferred) to work alongside the founding partners’. Elsewhere, insights from physics have fed the development of models that provide understanding of wealth and poverty distributions.
To those working in them, there are several very different fields of study here: on a scale from everyday application to underpinning research (or from small to large scale) you will hear variously of ‘quantitative finance’ at one end, ‘econophysics’ at the other, with ‘financial engineering’ and numerous other niche labels in between. For my present purposes, however, these differences are a distraction. The important thing is an overarching view of the space within which monetary transactions occur as a statistical universe whose characteristics permit use of models derived from the physical. Some of these models are familiar to me from other areas of study, some are new. There seem to be few aspects of classical physics that have not been applied to financial or economic work by someone, at some time. Some of the most ‘gee whizz’ stuff, like the small team trying to relate fundamental fiscal granularity to string theory, is being done in-house by financial or physical science institutions and is densely hedged around with NDAs.

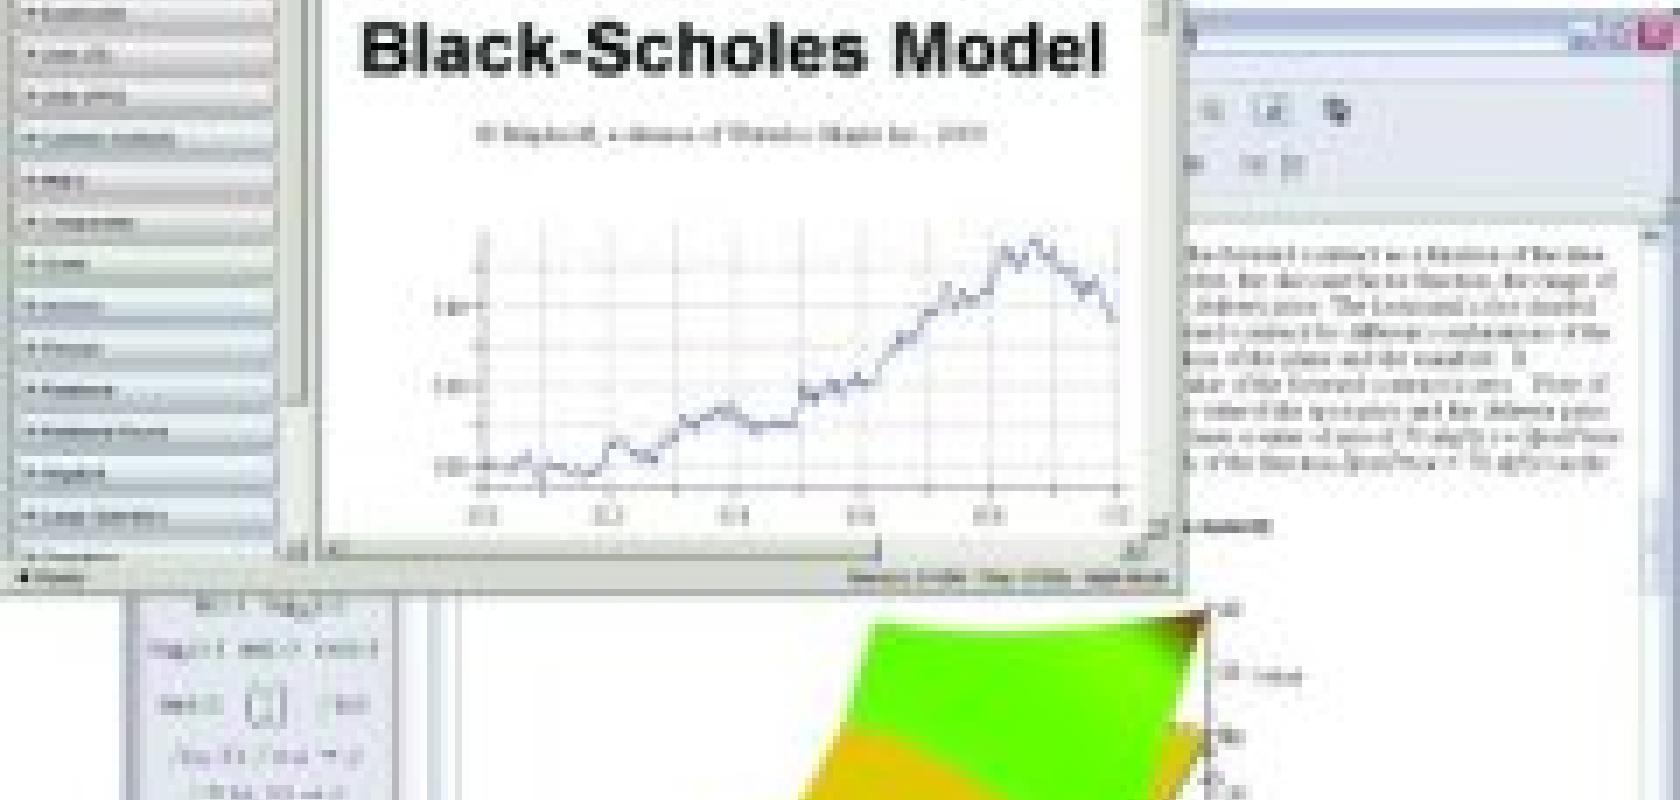
Maple's free download Black-Scholes workseet (foreground, top left) and a screen from the Derivative Securities book (background, bottom right).
The starting point, though, for a first-time tourist like me, is a concept from primary school science. Brownian motion, as I have just established by asking a 10-year-old, is defined as ‘bits of stuff being kicked around by atoms’. By analogy, the movement of price in a market is the sum result of discrete financial items (such as derivatives or other instruments) being kicked around by sellers and purchasers. In both physical and financial contexts the kicking around can be described by much the same strict stationary stochastic processes, the particle taking a random walk. To follow the ramified implications of this analogy is to undertake a never ending, ever more complex, and frequently disputatious journey which, though fascinating, I don’t intend to describe in much detail here. The classic description of the walk is in terms of a Wiener process, which is expressed in finance as the Black-Scholes model, partial differential equation and formulae.
Fischer Black and Myron Scholes published the work which gave their names to this model in 1973[1], though they built on prior foundations laid by others (notably Merton, Samuelson and Thorpe, though Thorvald Thiele discussed the mathematics of Brownian motion in 1880[2], 25 years before Einstein and Smoluchowski, and as early as 1900 it was proposed as a stock price model by Louis Bachelier[3]). The model itself defines incremental change in stock price for the underlying instrument in terms of a geometric Wiener process with constant drift and volatility; the price evolution of a dependent derivative is then expressed as a PDE, from which pricing formulae are applied to put and call options.
Black-Scholes has shortcomings as a realistic model of the observed stock market. One of its assumptions is that no opportunities for arbitrage exist, which is not true in the real world (though globalisation of communications is narrowing the discrepancy). Allowance has to be made for discrete yields, and the assumption of an underlying normal distribution is belied by observation. A binomial model can be used to better effect as an alternative to the American option.
A lot of study has gone into ways of balancing greater reality with usable simplicity. Miyahara and Novikov, for example, examine a number of adjustments based on minimal relative entropy[4]. The spread of cheap computing power continually makes usable simplicity a shifting concept, permitting more attention to reality with time.
With or without development and fine-tuning, the model is close enough to persist as a useful tool and much energy is expended in efforts to close the gap. In both physical and financial universes, anything which brings predictions closer to reality than chance alone will always be of value. That being the case, off the peg Black-Scholes software calculators of varying sophistication and usefulness abound and users of the big mathematical packages also have ready made resources available to them.
Maplesoft, for instance, offers a free download Maple worksheet[5] demonstrating three Black-Scholes based methods in its range of financial and economic examples. Wolfram, in its information centre, lists resources including a textbook linked package[6] and a notebook[7] demonstrating convergence at limit with the binomial option model.
Moving beyond shared worksheets, many of the heavyweight mathematics software products offer full commercial bolt-ons of various kinds. The MathWorks, for example, offers a Financial Toolbox for Matlab which, together with the statistics optimisation toolboxes, provides extended functions for mathematical and statistical handling of specifically financial data. Wolfram has the Finance Essentials package for accelerated development of new models from established building blocks.
It is, of course, perfectly possible to use any of these environments to grow your own materials and methods from seed. That approach makes little sense if you are professionally involved in realtime financial markets work, where established methods are available, since reinventing the wheel is far too slow a process for what is a very fast moving and rapidly mutating commercial battlefield. It doesn’t take long to burn up in experimentation enough time to have paid for an off-the-peg solution that is ready for you.
You are probably curious about how your own particular background and expertise in a hard science or discipline relates to this area – in which case, to a very large extent, the answer is ‘as much as you want it to’. If your interest is in pure scientific enquiry there are no limits at all, and any new direction has at least the potential to be an area of future commercial application. Maple has a Derivative Securities book that provides an excellent entry point for learning the ropes; beyond that, a search of the existing literature turns up both gaps for exploration and methods for adoption.
Volatility analogous to changes of physical state, with latent energy plateaux and foci of crystallisation or gas nucleation sites and so forth, has its equivalents in financial behaviours with existing models tunable to quite closely reflect, for instance, a sudden shift from sluggish markets to explosive growth. Thermodynamic metaphors (such as ‘cooling of the consumer spending boom’ for instance) abound.
Two recent PhDs talked to me about a study of securities collapse on which they are now working. One of them referred to their critical data collection regime as a Geiger counter, while her colleague used the term ‘death chirp’. Both referred repeatedly to growth and decay curves, to the circumstances in which those become unstable, and the consequences of singularity.

Normalised butterfly catastrophe 'life and death' zones for a security, visualised in Mathematica
Earlier this year, The European Physical Journal B published a paper[8] by Andrew Clark, a senior research analyst from Lipper (a Reuters company dealing in collective investments intelligence) exploring the modelling of mutual fund flows through stochastic catastrophe theory (SCT). Financial and economic systems are noisy, and don’t submit to the deterministic assumptions of pure catastrophe theory, but a stochastic equivalent first developed 20 years ago[9] with a view to statistical modelling of experimental biosciences data was recently generalised[10]. My experimental aspirations were more modest: it’s possible to do a lot of fast dilettante exploration of underlying models, and thus learn a lot, without the sophistication required for accurate or predictive use. A six-year-old package designed for performing local singularity theory problems in
Maple V[11] was far more capable than I needed, gave me the wherewithal to compare hypothetical possibilities with known situations, and taught me a lot about implementation too. Constructing different scenarios in Maple, tuning parameters to see how well they can be made to mimic particular past event structures, the broad similarities and differences between physical and financial views of the world begin to emerge.
My experimental play in these areas doesn’t begin to approach the needs of applied financial engineering. Speed, solidity and maintainability are all needed, in different mixes according to context. The best way to develop models depends on who will use the results, and under what conditions. At the leading edge of development within competitive environments, bespoke development tools may be used but the advantages of existing generic software are compelling. Where transparency is the most important consideration, UML-based model builders are useful but lack the directness of compact symbolic methods. A common alternative approach is to develop methods in symbolic algebra packages, bury them in black boxes, connect their inputs and outputs to dialogue interfaces (perhaps in HTML), and execute them through a numerical engine.
Algebra packages such as Maple or Mathematica are well suited to developing and testing models, and browsing through their websites can be fruitful. Searching Wolfram’s knowledge base turns up a wealth of material. Matlab provides a powerful numeric execution platform, and it too has a solid range of provision. Apart from the already mentioned Financial Toolbox, a Financial Derivatives Toolbox, and more general toolboxes with applicability to financial work, there is one for fixed income securities and a specialised extension in the form of the GARCH toolbox. GARCH [12] (Generalized Autoregressive Conditional Heteroscedasticity) is a time series method for modelling serially dependent variances, and hence price volatility. It offers resilience in dealing with compressed (platykurtic) distributions and clustering, both typical of financial returns. Various methods (see Kalantzis and Papanastassiou [13]) are used to classify processes by inspection and discriminant function.
Symbiotic use of Maple and Matlab together was a recurring theme. There are the Symbolic Math Toolboxes, of course, and the impressive new Maple Toolbox for Matlab, but home-grown interfaces and other joint operations abound. Discussing the history of their products in the finance sector, representatives from both MapleSoft and The Mathworks surprised me by saying that financial engineering has been a part of their customer base demand for a long time – ‘from the inception of the company’ in one case, ‘as long as I can remember’ in the other. Both, however, referred to recent growth: one commented that ‘if you can say that there are few definable key segments, then finance has recently joined those’.
Statistical data analysis products are obvious candidates too. Insightful’s S-Plus, for instance, is heavily used in the financial and economic sectors, and is also supported by specialised add-on modules: the finance specific S+FinMetrics, supported by optimisation package S+NuOpt and the more general S+Wavelets. For S’s open source doppelganger, R, there is Rmetrics – a collection of functions assembled by Diethelm Würtz at the Swiss Federal Institute of Technology’s Institute for Theoretical Physics. Statistica Data Miner is used by banking and finance, and can make use of R functions [14].
Other software environments are useful too, especially those designed for modelling. I spent a considerable amount of experimental time for this piece in Simile, and learnt a great deal about both possibilities and problems from discussion with Alexander Lesnikov of Atebit.
This was a far larger area than I imagined, and summing up isn’t easy. The extent of actual or potential scope for use of physical sciences models in finance and economics seems to be unlimited. I was personally intrigued by two aspects: the possibility which it opens up for Victorian-style individual amateur work that is now difficult in the physical sciences, and the close correspondence with use of physical models in other nonphysical fields that I already know. Emotional objections are familiar too, such as the feeling that ‘people are not numbers’ and shouldn’t be quantitatively analysed, here extended to money as a human invention. Above all, the extent and variety of real physical sciences talent now recruited into these areas surprised me, though in retrospect it should not have done. One thing of which I have become convinced (though I was sceptical when I began): this is as much a science as any other.
References
1.Black, F. and M. Scholes, Journal of Political Economy, ‘The Pricing of Options and Corporate Liabilities’. 1973. 81 (3): pp.637-54.
2.Thiele, T.N., Sur la compensation de quelques erreurs quasi-systématiques par la méthode des moindres carrés. 1880, Copenhagen, C. A. Reitzel.
3.Bachelier, L., Théorie de la spéculation. 1900, Paris,, Gauthier-Villars.
4.Miyahara, Y. and A. Novikov. Geometric Lévy Process Pricing Model. 2001, University of Technology, Sydney.
5.Black-Scholes Model. [Maple 10 worksheet]. 2005. Available from: http://www.maplesoft.com /applications/ app_center_view.aspx? AID=1680&CID=6&SCID=67.
6.Miller, R.M. Black-Scholes Option Pricing Model. [Mathematica package] 1998 [A detailed description can be found in The Mathematica Journal, v1n1, p.75.]. Available from: http://library.wolfram.com/infocenter/ MathSource/3238/.
7.Benninga, S. and Z. Wiener. Black-Scholes. [Mathematica workbook] 1997 Available from: http://library.wolfram.com/infocenter/MathSource/3238/.
8. Clark, A., The European Physical Journal B - Condensed Matter and Complex Systems, ‘Modeling the net flows of US mutual funds with stochastic catastrophe theory’.2006. 50(4): pp.659-669.
9. Eric-Jan, W., et al., Physica. D, ‘Transformation invariant stochastic catastrophe theory’.2005. 211 (3-4): pp.263-276.
10. Cobb, L. and S. Zacks, Journal of the American Statistical Association, ‘Applications of Catastrophe Theory for Statistical Modeling in the Biosciences’.1985. 80 (392): p. 793-802.
11. Kirk, N.P., The London Mathematical Society Journal of Computational Mathematics, ‘Computational aspects of classifying singularities’.2000. 3: pp.207-228.
12. Bollerslev, T., Journal of Econometrics, ‘Generalized Autoregressive Conditional Heteroskedasticity’.1986. 31: pp.307–327.
13. Kalantzis, T. and D. Papanastassiou, Classification of GARCH Time Series: A Simulation Study, in International Symposium on Applied Stochastic Models and Data Analysis. 2005 École Nationale Supérieure des Télécommunications de Bretagne.
14. Statsoft (2003) STATISTICA Data Miner: Integrating R Programs into the Data Miner Environment (a Statsoft Business White Paper). Available from: http://www.statsoft.com/support/whitepapers/pdf/STATISTICA_Integrating_…
Arbitrage: exploitation of price differentials between markets. In many practical situations transactions may be conducted in more than one market, simultaneously buying in one (where prices are low) and selling in another (where they are higher).
Derivative: an investment which derives its pay off not directly from trade in goods but from the performance of an ‘underlying’, which is usually an asset, index or rate. Assets may be concrete base level commodities (i.e., goods considered as material for exchange rather than for end use) or, equally well, referential abstracts such as debts or shares, or even contracts which are themselves derivative. Indices may be obvious financial measures but can just as well be something else entirely (weather or war, for instance) which affects trade conditions.
Instrument: a conceptually packaged form (effectively, an object) of tradeable assets or derivatives, enabling their convenient utilisation as units for trade.
Option: a type of derivative in which one party to a contract has a right but not an obligation to complete within a certain time frame, the party holding the option paying a premium to the other party. A ‘put option’ is an option to sell, a ‘call option’ is an option to buy. There are various ‘styles’ of option, including American (the option may be exercised at any point within the time frame) and European (the option my be exercised only at the closing date).
