Statisticians, despite popular perceptions to the contrary, are as fond of play as the next person – and for a statistician there is no bigger playground than ecology. It starts off at the same size as the planet, layers dimensionally upwards and downwards from human scale, has multiple expressions in uncountably many scientific study domains, extends backwards and forwards in time. And throughout all of that, it is intrinsically statistical.
The surge of public attention to the environment in the 1960s and 1970s after publication of Rachel Carson’s Silent Spring[1] was a key factor in making me a statistician, and many others of my generation make the same admission. Hippy illusion gave way to irresistible glimpses into endless unexplored vistas of complexly related data – and then came scientific computing to make the adventure feasible.
Ecology is, in conceptual essence, a statistical study of chreodic systems in perpetual flux, with dynamic equilibrium frequently rearranged by catastrophic shear planes.
Fire
Of those catastrophic interruptions, fire is the most dramatic both at the human scale and in terms of local destruction. As I write this, forest fires are in the news from Canada, Colombia, Madeira, Western Europe, and many parts of the United States. Each fire will reset the biological clock to zero and open up a race to re-colonise the space by everything that walks, flies, germinates or drifts on the wind.
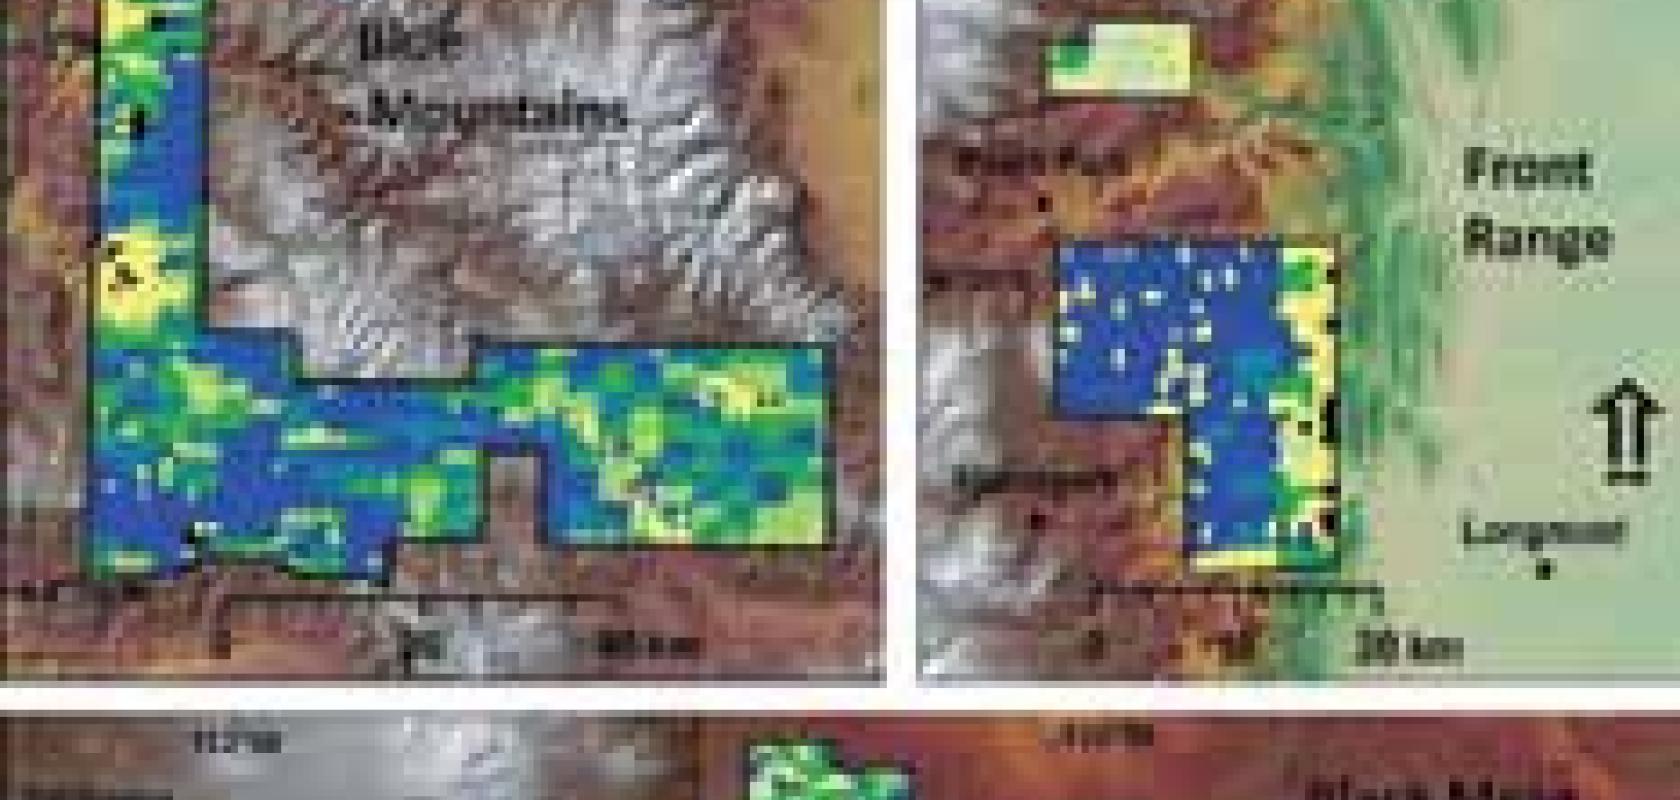
A major controversy, in which statistical evidence and methods are deployed by both sides, is whether preventing large fires promotes or reduces ecological processes and biodiversity. Statistical evidence in favour of intervention derives primarily from tree-ring reconstruction studies, which suggest that historical forest consisted of populations of widely-spaced, long-lived trees untouched by low-level brush fires which cleared ephemeral undergrowth. Analysis[2] of western US historical records and current GIS data, however, suggests that the composition of forests varied widely, with some areas fitting the existing model whereas others grew much more densely and with full, persistent lower-tier growth. This argument no doubt has a long way to run, but the new analysis does raise questions about the ecological benefits of woodland management.
In Colombia, observers retreating just ahead of the fire-front have been monitoring the movement and behaviour of the fauna. The researchers are interested in patterns of response, seeking to discover species norms and the chreodic limits to probabilistic variation from them. Multimodal capture methods stream data back for central analysis in Statistica, supplemented by on the spot work in SigmaPlot. Interim findings feedback to fine-tune practice and priorities on the ground.
Fire is dependent on a number of factors, notably climate and environment, and its presence or absence can definitively shape ecologies over very long periods. The Norway spruce, for example, established itself as the dominant swamp forest tree species across much of Norway and Sweden after recurrent burn-back cleared existing land, thereafter its presence created conditions in which subsequent major fire was suppressed. In some areas, however, this pattern did not occur: absence of any major fire left islands of deciduous species. Principal component analysis of pollen spectra in a long-term study of vegetation and fire history suggests[3] that this may have been the result of broader changes to local climate brought about by such an extensive predominant vegetation change.
Flood
Flooding is an ecological disrupter of a different but no less decisive kind, often with longer-lasting effects, leading to greater analytic complexity in its unravelling. Where fire sterilises a habitat and leaves it to start anew, flood-water mixes mutually incompatible types of habitat, shifts survival gradients, and moves organisms and material around.
If the water recedes relatively quickly, a frequent result is that some plant species have endured while others have perished. There will almost always have been chemical and physical changes in the soil. Silt and decaying organic matter may enrich the soil or poison it. If the waters do not recede, then a new aquatic ecology will establish itself in conditions strongly shaped by the character of the land which it has replaced.
Particularly interesting are those areas that are briefly inundated before the water recedes and those that end up below or just above a new water margin. I have recently been consulting on the data-analytic aspects of a study of the ecologies adjacent to waterlines in a number of separate, but physically similar valleys. One important strand is ecological comparison between natural lake valleys and those that have become naturally or artificially flooded. A number of similarities and differences (equally interesting and not always unconnected) are coming out of the waterline analyses.
(As an aside, the study involves several different academic, commercial, government and industrial partners, which has produced an interestingly shifting software ecology of its own. Data moves between heterogeneous, but interacting analysis products, from the commercial Analytica to the open source Xlisp-stat. GenStat is emerging as the landscape dominant species, though there are vigorous colonies of other products including a thriving population of three-dimensional visualisation packages as well as specialised tools such as FragStats.)
Dry-land habitats are not just shrunk by flooding of a valley: they are ruptured, and change their natures. Changes occur at differing tempos: very rapidly at the water’s edge; more slowly at greater distance from it. The fauna that continue to inhabit the area change their behaviour to accommodate new realities, while changes in both soil and microclimate affect vegetation. There seems to be evidence to suggest that the long-term tendency is for flooded valleys to move towards congruence with naturally occurring lake valleys, but quite profound statistical differences, and statistical processes of change persist between the two for many decades after flooding occurs.
Pestilence
Disease is a fascinating area of analysis: effectively, it is a term denoting explicit interaction between different ecological layers. In myxomatosis, for instance, a microbiological agent is transmitted through a mammal population by an intermediate-sized biovector. A more topical example is the infection of human tourists by hantavirus carried by mice. Human shaping of landscapes, for example in the establishment of food or cash crop monocultures, also shapes the epidemiology of ecological linkages. Laboratory work which identifies these links between scales often results from statistical analysis of infection patterns; exploring, quantifying, modelling and predicting their ecological effects and implications is an extension of the same analytic process.
War
War, in the human sense, has many ecological impacts: some of them akin to fire, flood, and pestilence (though often both more acute and more localised), others to industrial pollution or urbanisation. Once again, the degree of statistical complexity reflects the multiple interactions. From another viewpoint, though, constant warfare (or, equally important, strategies for its avoidance), overt or latent, between organisms, populations, species, or competitor types, is intrinsic to ecological equilibrium. The description and analysis of binding patterns within and between levels here is arguably at a higher level of complexity than any other. Within the complexity, however, are many tractable subsystems.
A recently published[4] study, widely picked up by mainstream news media, analysed statistically one strategy for the avoidance of ecological conflict. Tigers in Chitwan, Nepal, are found to spatially coexist with humans by temporal adjustment: they alter their habits to use paths at times when their human competitors do not. The authors set up automated cameras inside and outside a designated park to monitor the movements of tigers, their primary prey species, and human movements by category (resident, tourist, military and vehicular) with recording of time, GPS location, and so on, using statistical point-process modelling to estimate densities and traditional nonparametric methods to test for differences between loci.
Shared and unshared pathways also feature prominently in another of my recent analytic involvements: a long-term mapping, spatially and temporally, of fauna routes in a moorland habitat. The routes range in scale from those of shrews and other small rodents up to the largest local predator, the fox, with agricultural species, such as sheep or horses, and humans themselves as additional referent layers.
A few routes having been mapped in detail at a given scale, and their structures studied, volunteers go out and locate points on new ones. Data on the known routes are then used to try and predict how the new dots might be joined up; effort is then concentrated on locating new points using these predictions. Raw and processed data pass back and forth between handheld computers in the field and a base analytic centre, refining models on the fly. As gaps are filled in, analyses are repeated and improved. When a sufficient route density has been built up, the process is applied to predicting and locating nodes, thus accessing new route systems. It’s not a precise science (when was statistics ever?), but offers considerable improvement over blanket fingertip searches.
With the paths themselves located, relationships between them are examined in ways analogous to those in the Chitwan study above. Once a pathway is opened up by a small animal, a larger one will often use it as the line of least resistance and thus enlarge it, after which it will again be utilised by a larger animal still, and so on. The smaller species may then abandon the route and forge a new one, share it, or adjust their usage of it. There is a surprising degree of overlap between predators and prey, but also a considerable parallelism between routes of different scales. Statistical analysis of spatially related routes, combined with temporal traffic mapping, offers a lot of insight into the ecological relations at work within the habitat.
Playgrounds can 
be serious places
My opening characterisation of ecology as a statisticians’ playground should not be taken as a trivialisation of the issues and implications involved. Far from it: the seriousness of meddling with mechanisms too big and complexly interrelated to comprehend is, of course, part of the draw. Before the advent of modern statistical analysis, there was no way even to begin the conversation about this seriousness.
Before the arrival of widespread computerised methods, there was no way to meaningfully develop it. Jabot and Bascompte recently[5] pointed out that, even now, we examine reductionist parts of the complex whole, and multitrophic methods are needed to build a more holistic analysis. Grimm and Railsback[6] comment that ‘modelling systems across scales and at multiple levels – especially to link population and ecosystem dynamics to individual adaptive behaviour – is essential for making the science predictive’. But statisticians are, first and foremost, explorers for whom both the scale and the seriousness of the challenge make the playground metaphor unavoidable. We are, like Newton, children mesmerised by pebbles and shells on the shore of an immeasurable ocean; but pebble by pebble, shell by shell, immensity is comprehended.
References and Sources
For a full list of references and sources, visit visit www.scientific-computing.com/features/referencesoct12.php
Human activity is a major factor in the development of ecologies, particularly where urbanisation or infrastructures are involved. Building a motorway disrupts the ecologies through which it passes on a very large scale during construction, and leaves them permanently changed in the longer term, but also creates new corridors between them as embankments mature into habitats of their own. A housing development (quite apart from the construction phase) drops a whole new ecological island into the middle of an existing one.
Less obvious is the role which aesthetics play in such impacts. Successful resistance to development in its area by a human community will prevent ecological change in one place and may either prevent it from occurring at all or, in many cases, redirect it elsewhere. Some protests (motorways through breeding grounds for endangered toads, for example, or tidal barrages across estuaries) are on explicitly environmental grounds, but many more are powered by a desire to preserve aesthetic aspects.
Perhaps the most prominent example of this is the resistance to siting of wind turbines which, practical arguments aside, produce extreme reactions of love and hate among those who live in the areas where they might be erected. Since the arrival of a turbine farm in an area will inevitably have positive, negative and zero sum impacts on local ecologies, aesthetic perceptions become a deciding factor in ecological outcome. The exact anticipated visual, rather than actual, impact of turbines thus becomes an ecological force. Objectively assessing that visual impact can be problematic. Enter ‘viewshed’ analysis.
A ‘viewshed’ is a landscape component visible from a given viewpoint. In this context, it will concern the number of turbine structures visible, at any one time, to a human observer positioned within the landscape under consideration. Viewshed analysis (a common facility in geographical information software) establishes exactly what can and cannot be seen from each specified cell within a digital elevation model of the terrain.
Atmos Consulting, which specialises in renewable energy and environmental issues, is one user refining this approach. The computer model which Atmos is developing seeks to reduce the complexity of viewshed analysis for proposed wind turbine developments to a prediction of cumulative visual impact. The aim is to provide information in a form which takes relative distance, size and perspective into account while delivering easily comprehended output that will be of practical use in public consultations and planning decisions.
As well as simplifying the consumer view of the data, Atmos’ model also seeks to increase resolution so that individual turbines (rather than aggregated farms) contribute to the outcome.
