'However erroneous the theory upon which the cartographers evolved their maps, mine were not entirely useless; though they required considerable mental mathematical gymnastics to translate them into usable information... the actual and the apparent measurements of distance can be reconciled by multiplying each by the square root of minus one!' (Edgar Rice Burroughs, Escape on Venus, 1946)
Edgar Rice Burroughs' strange description of Venusian cartography does contain one grain of truth: that manipulation of map data comes down to mathematics. Over the past few decades, a variety of areas of computation – map projections, geodesy, photogrammetry, computer graphics, matrix operations, interpolation, polygon, overlays, map data coding, and so on – have become increasingly unified as 'analytical cartography'. This covers a spread from fairly pure maths, simple operations on schematic maps and coordinate systems, to sophisticated bundled applications: geographic information systems (GIS) capable of manipulating complex cartographic data.
At the pure maths end of the spectrum, Maple, for instance, has coordinate transformation functions that can be applied to mapping (in 1999, Taylor, Baur and Oprea developed a set of mapping routines for Maple V, using differential geometry to build on its 'addcoords' and 'changecoords' functions). Mathematica 5.2 includes similar built-in CityData, Geodesy and WorldPlot packages, which together allow plotting of world maps from vector data of country outlines, different projections, and point-to-point distance calculation. Wolfram recently released GeometricalGeodesy, an application package that further extends this to high-precision computations of distances, directions and coordinate systems.
With more specialised cartographic applications, however, the mathematics becomes increasingly hidden 'under the hood'. Matlab, for example, while still offering command-line functions, provides graphical user interface (GUI) control panels for many mapping tasks. Its Image Processing Toolbox contains a graphical tool, cpselect, for selecting control points for orthorectification (converting, say, a satellite photo to the coordinates of a ground-based coordinate system). Likewise, its Mapping Toolbox accesses similar world data and cartographic functions to those in Mathematica, but through an optional integrated GUI kit.
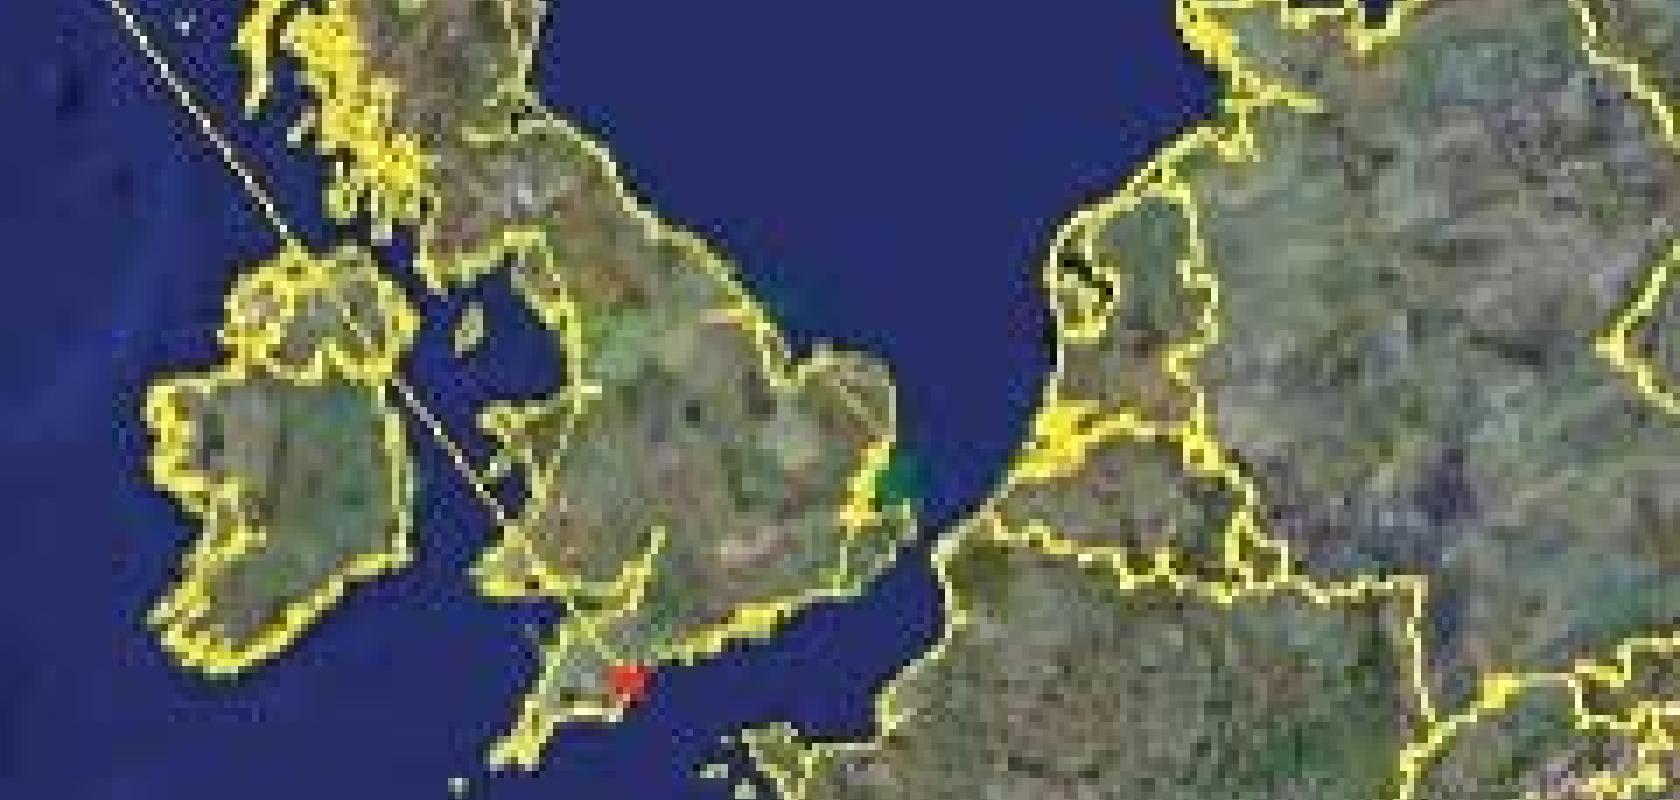
 Google Earth, a sophisticated Geographic Information System.
 Beyond this, the Matlab Mapping Toolbox also reads a variety of external cartographic data formats, primarily from US public domain sources. This breaks into the territory of the GIS: an interface for customised access to map data stored digitally in multiple formats. You can get a good idea of what a fully-fledged GIS can do by downloading Google Earth, the 3D digital model of the Earth (named Keyhole by its pre-Google developers). Its interface is a spinnable globe that combines satellite and aerial photography with geographical overlays, all packaged as a broadband application to stream the data to a standard PC.
Although a mainstream product, Google Earth exemplifies the type of function found in a powerful GIS. It combines raster data (such as bitmap images of aerial photographs), vector data (such as road paths, bounded areas and elevation values) and attributes (such as a text description of what lies at a defined location), and allows manipulation, such as rotation and zoom, and selective display of this data. Although some of the ideas behind GIS are pre-computer (for instance, flippable overlays) it primarily dates from the 1950s, notably in the Canadian Geographic Information Systems (CGIS) project for handling land-use management data. Since then, the field has diversified across many academic and corporate data providers to the point where it's the dominant means to handle mapping, whether general cartographic or scientific.
From a data management viewpoint, the downside of such diverse origins are the many independent formats that have arisen. As with conventional graphic files, there are dozens of cartographic file formats. Major ones include Arc/Info, that used by the products of Environmental Systems Research Institute (ESRI), the largest and oldest GIS company; GeoTIFF, an industry-wide format that encodes geographic information as descriptive tags in TIFF graphics files; and Digital Elevation Model (DEM), the US Geological Survey ASCII raster format for elevation data. Data handling is complicated by cartographic data existing not merely as files, but as complexes of linked files: for instance, the ArcView GIS program's native format, the 'shape file', comprises a coordinate, a database and an index file.
The influence of GIS has been especially noticeable in the scientific field. Contour format persists for general-purpose topographic maps, but shaded relief is superior for data visualisation. With computer rendering, the latter is easily generated from data, and can be overlaid usefully with other data. For instance, shaded relief applied to the usual colour-coded geological map conveys very clearly the intimate relationship of geology and topography.
The need to recover the investment required for land, aerial and satellite surveying means that cartography is a highly commercialised field. The many excellent free services available to casual users – such as the Ordnance Survey Get-A-Map – are generally spinoffs from (or promotion for) services for customised and/or higher resolution maps. For example, the basic Google Earth is subsidised by Google Earth Pro, which adds essentially corporate functions, and a glance at the copyright statements as you scoot across Google Earth shows its underlying data has a similar basis: for instance, MDA EarthSat deals in NaturalVue products, natural colour Landsat 7 images down to 0.6 metre resolution; and DigitalGlobe in orthorectified images from its own QuickBird satellite.
If you want to experiment with GIS for practical or recreational purposes, free data and the means to view and process it are available, but may require a little ingenuity. By far the best coverage is of the USA and from US sources. Probably the most straightforward access is via the USGS Seamless Data Distribution System (http://seamless.usgs.gov), where you can download a variety of datasets – notably Shuttle Radar Topography Mission (SRTM) digital elevation data at 90m resolution – by selecting map area. This site also offers worldwide coverage. For the UK, the University of Manchester based Landmap Project (www.landmap.ac.uk) provides various data including SRTM, Landsat images and 25m DEMs, but download is available only to subscribing academic institutions.
Such data is, incidentally, not generally in a form viewable with a web browser; dedicated GIS programs can not only read the native GIS file formats, but extract them from the zipped archives used for online storage. A typical product is Global Mapper Software's Global Mapper, whose demo version can read and manipulate all the standard GIS formats: for instance, converting DEM into shaded relief. There is some overlap with recreational landscape modelling software such as the freeware Terragen (www.planetside.co.uk/terragen) and the commercial Mojoworld (www.pandromeda.com), which as well as creating imaginary worlds, can be used to render real-world data.
Rising tides
 Flooding is a potent apocalyptic scenario: here, Flood Maps recreates the profile of Inland, the post-disaster Kent in Russell Hoban's novel Riddley Walker (see www.graphesthesia.com/rw/ pic-largemap.html).
 Flood risk and management of coastal evolution are currently very topical as applications of analytical cartography. On the one hand, the 2004 Boxing Day tsunami and the 2005 New Orleans flood have prompted examinations of rapid disaster scenarios; a few weeks ago, the BBC reported the Flood Risk Management Consortium's simulation of a seven-metre storm surge on the Thames, similar to that in 1953 that led to the building of the Thames Barrier.
On the other hand, global warming issues have prompted many studies of long-term trends, and maps of landscapes with various sea levels – for instance, Britain reduced to an archipelago – have become staple projections. The general vulnerability of Britain's coastline can be seen from a browse of the interactive map at the Environment Agency website (www.environment-agency.gov.uk), or from Floods Maps at http://flood.firetree.net (a very nice Google Maps hack by Alex Tingle that overlays a UK map with a variable sea level derived from NASA SRTM data).
 A somewhat fanciful rendering of DEM data for Portsmouth Harbour and the Solent (the pinnacles are pixel artifacts). Zipped data from the USGS has been imported by Global Mapper, converted to grey-scale, and rendered in Terragen.
 However, predicting coastal change by simply ramping up the sea level is only an approximation, and the area of the Solent and Isle of Wight provides a good idea of the difficulties. Whatever global sea level may be doing, the English south coast is sinking anyway due to post-glacial isostatic rebound (readjustment of land levels, which conversely produced raised beaches in Scotland). Its north side, low-lying Tertiary clays, faces simple inundation; while the south side, unstable Cretaceous cliffs facing the English Channel, is prone instead to erosion. One example is Blackgang Chine, first documented in the 1700s as a 'steep gaunt ravine' and in 1842 landscaped as a scenic attraction by Alexander Dabell. However, the chine was progressively blunted by collapse and erosion over the 20th century, the Dabells' theme park progressively retreating landward; now only an area of landslip remains. In worst cases such as this, managed retreat is the only feasible option.
For managing such changes there are several dozen studies and schemes, coordinated by the Isle of Wight Centre for the Coastal Environment, all informed by the Integrated Coastal Zone Mapping project (ICZMap), of which the Isle of Wight was a pilot area. ICZMap, which illustrates the fairly horrendous data processing issues that may lie behind integrating cartographic sources, was a project to integrate three datasets for the British coast.
Coastline data is problematical for a number of reasons. For instance, a coastal geomorphologist's assessment of active cliff may differ from a land surveyor's definition of cliffline; for this reason, ICZMap has based its historical data where possible on aerial photographs (available from the 1940s) rather than old maps. A further difficulty is that the Ordnance Survey, UK Hydrographic Office and British Geological Survey all had coastal data based on different height datums. The OS, based on its MasterMap database, used the land-based Newlyn Datum; the UKHO used the sea-based Chart Datum, based on local tidal data; and the BGS data was internally inconsistent, with mean low water (MLW) differing between sheets. The two-year project involved extensive digital reprocessing to correlate these datasets.
Further reading
- Integrated Coastal Zone Mapping (www.iczmap.com)
- Isle of Wight Centre for the Coastal Environment (www.coastalwight.gov.uk/projectsresearch.html)
