No area of work is more closely associated with data analysis than agriculture. Statistics as a concept grew out of the need to quantify agricultural production for taxation purposes. Modern statistics as a coherent, mathematically-based field was shaped by a need to quantify agricultural investigation. Most generic methods can be traced back to an agricultural point of origin. The great landmark adventure of recent years, the sequencing of the human genome, concludes an intellectual story line that started with a statistical view of inheritance in peas. Astronomy and mathematics owe most of their history to the need to better predict seasons and the flooding of farmlands.
And it is inevitably so. No other strategic concern of the human race is so much at the mercy of a statistical universe. Within the controlled environments of manufacturing, ever smaller numbers of components escape the ever-tightening loop of quality control. In the fields, we remain concerned with the percentage of crop that can be brought to usable yield.
Agriculture has, to be sure, done serious quality control loop tightening of its own; but fewer of the affecting factors are amenable to human control than is the case in manufacturing – and the degree of control is less complete by many orders of magnitude. If production quality for left-handed silicon widgets is temperature dependent then I can easily control the temperature of the manufacturing environment within a few degrees. If I am a wheat farmer, however, I am limited to modest and partial amelioration of what the climate throws at me. The individual ear of wheat cannot be protected; my aim has to be maximising the number of ears per hectare that survive to be harvested and eaten.
Some day, perhaps, all food will be synthetic: biomass grown in orbital tanks, on nutrient broth mined from the asteroids and Saturn’s rings, then knitted into palatable forms, all under quality control comparable to current silicon chip production. Perhaps. That day is a long way off, though. More modest industrialisations, such as greenhousing, polytunnel cloching and hydroponic production are with us already, but are generally focused on market value position or marginal capacity. In the foreseeable future, a rising population will for the most part depend upon nutrition grown in dirt, under sky, battered by weather. In improving the efficiency with which we discern and exploit the patterns within that environment, computerised methods are as important as in any other area of science.
In this battle to maximise yield, data analysis is applied across a range of scales, but they can be split crudely into tactical and strategic approaches. Strategic application seeks to refine global understanding of the factors that affect success; tactical use is aimed at specific application of that understanding to a particular area, location or context. Linking the two, embracing both, is a mesh of research and modelling cycles.
All of this makes for a huge subject, and trying to address agricultural data analysis in a few pages has more than a hint of hubris. All that anyone can hope to achieve is a representative lucky dip into diverse topics.
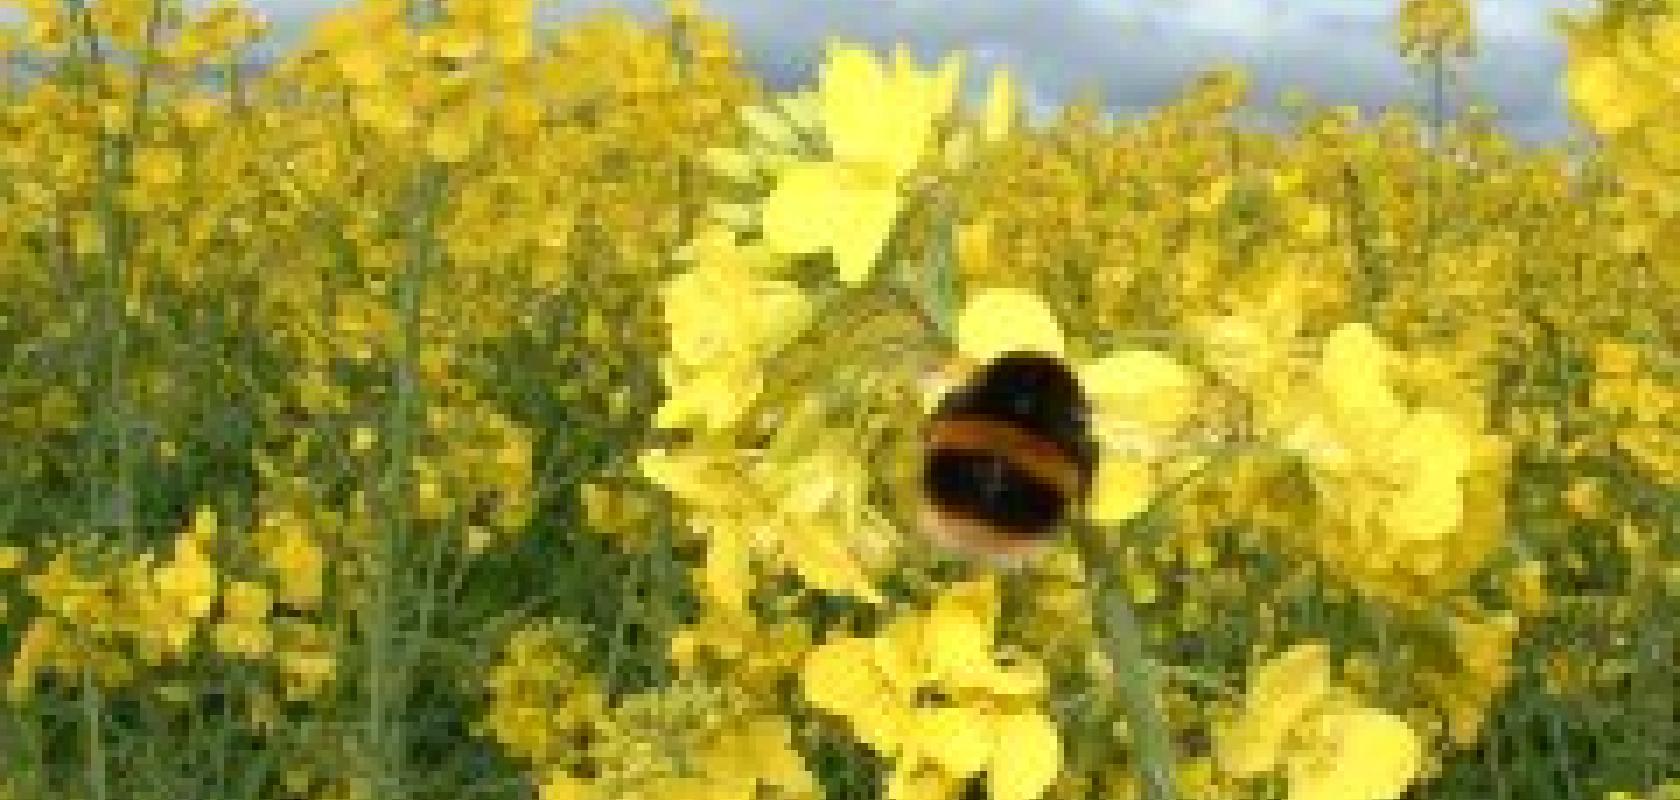
Bees have been news over recent months, with claims that patterned radiation frequencies from cellphones and other devices (scientific computing devices among them) may be disrupting apian navigation systems and contributing to a dramatic rise in the incidence of colony collapse disorder (CCD). There is (as yet, anyway) little or no evidence to support that theory, but the colony collapse phenomenon is real and, given the role of bees in pollination, potentially of vital interest to agriculture at large. Einstein famously said that humanity would survive the extinction of bees by four years; agricultural researchers I talked to during preparation of this feature suggested alternative estimates between two years and a decade, and pointed out that bees are not the only insects to act as pollen transmission vectors, but nobody doubts the seriousness.
Prime targets for suspicion as the cause or causes of CCD include the usual suspects such as genetically modified crops, pesticides, and so on, but also new virus strains. Numerous data analytic studies in search of clues have been, and are being, conducted across a wide spread of theories, although funding for them is reported to be in surprisingly short supply. Some studies seem to suggest an association with bacterial toxins. Others suggest yeasts linked to point melanisation, and some researchers in the US are putting their money on a virus dubbed IAPV (Israeli acute paralysis virus), which has emerged as a significant marker for the occurrence of CCD[1].
A number of studies indicate that wild bees are significantly less affected than farmed species, suggesting that monoculture may be part of the problem – we have become very dependent, globally, on one honey bee species to the detriment of pollinator diversity. Bee colonies are frequently moved into an area at bloom time to raise pollination rates, then removed after it, in a vicious circle of exacerbated decline among indigenous pollinators –wild bees have fallen to extinction levels in many areas of the US, or been replaced by Africanised populations, which pose new problems countered by extermination.
Monocultures are good for production efficiency (and make life easy for investigating statisticians!) and are therefore widespread in agriculture, but they also facilitate rapid spread of pests and diseases. Introduction of new crops intended to stabilise both erosion and social hardship frequently lacks any real knowledge of how the plants will interact with local pollinators or the ecological mesh upon which both depend.
Taking a step back from CCD itself, towards the strategic end of the spectrum, the US Department of Agriculture (USDA) has a programme at the Carl Hayden Bee Research Centre (CHBRC) to investigate the behaviour of normal healthy hives. Data structures of interest can be as large as territorial foraging behaviour outside the hive, as tight as the organisation within it, or the even smaller scale vibratory techniques that dislodge pollen within an individual flower. Primary attention is on stimulus/response linkages modelled, manipulated and visualised in Wolfram Mathematica. For interested lay bystanders there is an online simulation, BeeBop[2], which allows modelled experimentation with factors affecting colony population.
From bees to trees may seem a leap of scale in both spatial and temporal senses, but as data entities they have more similarities than might be expected. Data analysis is applied to the rise and fall of species within a woodland, surrounding ground cover, water availability distribution, inhabitant fauna, and so on. Stumping around a variety of arboreal European and North American management areas (both plantations and natural habitats) I was several times referred to work only just reaching implementation as a result of a nineyear-old bird species study by Merrill and others[3]. This longer scale makes careful planning on the basis of reliable data analytic input even more crucial than in areas that show results on an annual basis, but approaches are the same.
Design of experiments (DoE), for example, which originated and proved its worth in shorter-term crop cycles, is even more vital to forestry work. One of Merrill’s co-authors, Professor Gary Oehlert of Minnesota University’s school of statistics and author of a standard textbook[4], is frequently to be found in the literature of agricultural biodiversity research and it also comes as no surprise to find him advising StatEase, authors of DoE package Design Expert. DoE is strongly represented in current analytic software, both as free-standing dedicated tools and as options within generic packages, and the full gamut can be found in agricultural use. Design Expert, best known of the purpose-built products, crops up everywhere from its middle US heartlands to the Queensland rainforests and pineapple farms of Australia. Fusion Pro, a product that combines DoE with data mining methods, is crucial to one fascinating if frightening project, run by a large agribusiness corporation, which I visited. Set in an area that represents every methodologist’s nightmare (a conjunction of coastal forest, industrial fishery, swamp, desertified scrub, hardy livestock and marginally arable land) it aims at deriving an information base to support long-term development of products and methods for an agricultural future disrupted by climate change.
Most areas of work have their dominant tools, and most software packages carry the inheritance of their origins – one descending from design in a particular industry, another in a university faculty of psychology, and so on –often resulting in particular strengths and loyalties among users from the same background. In agriculture, the data analysis product with the deepest roots of this type is GenStat – now generalised to a wide range of statistical practice, but still with a wide life sciences user base and a direct developmental line from the work of the Rothamsted research station and the Lawes Trust. VSN International (VSNi), which now develops and markets GenStat, retains strong links to agricultural research and development, and supplies a stripped-down version of its product (GenStat Discovery Edition, or GDE, due for its latest upgrade at around the time you read this) free to research workers in the Third World. The portfolio of work on which GenStat has seen service ranges from designed experiments in European forestry and crop hardiness studies in Canada, through irrigation and flood effects tracking in Africa and the Indian subcontinent, to planned dairy breeding in New Zealand and experimental organic pest control in Papua.
It’s not just the software giants that see serious agricultural use, however: even large studies or big organisations may apply less obvious products where those are seen as the best fit for a need. John Deere, one of the world’s largest agricultural machinery manufacturers, uses XLfit for field analysis of relations between speed, harvesting efficiency indicators, and grain loss – the data being read into the Excel sheet directly from onboard sensors. That Systat has been used to analyse results of artificially inseminating viviparous fish with frozen sperm[5] will not surprise anyone; finding that its more populist and user-friendly stable sibling SigmaStat clocks up a significantly greater number of currently published agriculturerelated studies (the role of mitochondria in steroidogenesis[6], for example, or interactions between viruses and bacteria in inland water systems[7]) may be less expected. Such smaller user-friendly software products also tend to be favoured by small local projects with purely tactical objectives, run by farmers or volunteers with little, remote or non-existent institutional backing. In the Third World, they are joined by open source ware if the necessary expertise exists.
The outdoor nature of most agriculture, and its dependence upon the wild or managed ecosystems around or beyond it, has profound implications for modelling. A model always bargains with reality, seeking ways in which complex interactions with scales above and below its own can be reduced to simplistic aggregated inputs and outputs. In laboratory and industry, this is relatively easy to do; both can, to a useful degree, be physically isolated from the world at large. For most external agriculture, this is not so: it is part and parcel of the world at large, with only physical distance reducing the effects of factors beyond the model’s envelope. To a much greater extent than in most areas of science, the envelope of the model is the whole globe. That doesn’t stop agriculture from enthusiastically building models, but it does lead to a different scale and range of problem-solving work.
The gridded global agricultural data needed to build encompassing models is available in increasing quantity, though in varying quality and density, and the same is true of global agricultural models. Individual nation states (or regional groupings) compile their own databases (for example, the UK’s Defra Observatory Programme and data from EUDL[8] or EDINA[9]), but this is inevitably further advanced in the developed First World, and there is a problem with heterogeneity. A variety of organisations seek to maintain global databases of greater or lesser currency and detail, such the FAO’s Gridded livestock of the world[10], and there is a significant move towards development of integrated systems – see, for example, the 2006 Conference on Hybrid Information Technology (CHIT) paper by Li et al[11]. These provide the beginnings of a basis for directly comparable work to be done in disparate contexts. The applications within which modelling is done are disparate in the extreme, but UM- based systems continue to gain ground. I’ve been shown a lot of projects based in STELLA, and the flexibility of SIMILE is a real strength when tying intensive local models to global data sets.
Despite the long-standing relation of data analysis to agriculture, and the degree of current progress, there is a long way to go.
References
The Empire that was Russia: http://www.loc.gov/exhibits/empire/
1. Bee Researchers Close in on Colony Collapse Disorder. Penn State News [Web] 2006 [cited 2007/09/10]; Available from: http://www.psu.edu/ur/2007/bees.htm.
2. An On-line Honey Bee Computer Simulation Model: WebBeePop! [Web HTML] cited 2007 11 June 2007]; Available from: http://gears.tucson.ars.ag.gov/beepop/.
3. Merrill, S.B., F.J. Cuthbert, and G. Oehlert, Residual Patches and their Contribution to Forest-Bird Diversity on Northern Minnesota Aspen Clearcuts. Conservation Biology, 1988. 12(1): p. 190-199.
4. Oehlert, G.W., A first course in design and analysis of experiments. 2000, New York; [United Kingdom]: W.H. Freeman. xvii, 659 p.
5. Yang, H., et al., Production of F1 Interspecies Hybrid Offspring with Cryopreserved Sperm from a Live-Bearing Fish, the Swordtail Xiphophorus helleri. Biol Reprod, 2007. 76(3): p. 401-406
6. Midzak, A.S., et al., Effect of Myxothiazol on Leydig Cell Steroidogenesis: Inhibition of Luteinizing Hormone-Mediated Testosterone Synthesis but Stimulation of Basal Steroidogenesis. Endocrinology, 2007. 148(6): p. 2583-2590.
7. Bettarel, Y., et al., Virus-Bacterium Interactions in Water and Sediment of West African Inland Aquatic Systems. Appl. Envir. Microbiol., 2006. 72(8): p. 5274-5282.
8. Edinburgh University Data Library Catalogue. [cited; Available from: http://datalib.ed.ac.uk.]
9. EDINA.
10. Gridded Livestock Of The World project. 2007 [cited; Available from: http://www.fao.org/geonetwork/srv/en/metadata.show?id=31016&currTab=simple.
11. Li, A.-P., Y. Jia, and Q.-Y. Wu, On Design of Agricultural Semantic Grid Portal and Implementation, in 2006 International Conference on Hybrid Information Technology. 2006. p. 387-391.
