A visit to the Olympic Museum outside Geneva gives a vivid illustration of how the sporting world has taken advantage of new materials and techniques for decades. Just looking at the shoes, skates or skis from past Olympic Games brings a smile to one’s face. It might seem that there’s not much more improvement we can squeeze out of the human body, even with advanced materials – but modern software is proving that idea wrong.
Increased power efficiency
A dramatic example comes from the world of bicycle racing, where Colorado Premier Training has found it can reduce the amount of power a cyclist needs to maintain a certain speed by more than 10 per cent – and over the course of a long race this can lead to greatly enhanced endurance. Indeed, while it sounds counterintuitive, it can happen that mechanical efficiency drops, yet speed increases. This is especially the case in competitive bicycle racing, where as much as 90 per cent of the power put into the pedals is needed to overcome wind resistance. ‘Each rider and bicycle is an individual system,’ explains Steve Owens, president of Colorado Premier Training, a company that has designed an instrumented wind tunnel to help worldclass riders find the optimal position. ‘There are lots of misnomers and false assumptions. For instance, the elusive “flat back” isn’t necessarily relevant to performance. Further, it’s not always the case that bringing the elbows in close to the body is the best,’ he adds. ‘Sometimes opening them out wide improves breathing and thus performance.’
‘We’ve never not been able to help a rider go faster,’ claims Owens. He cites one example of an elite rider who started out at a baseline of 397W to maintain 30mph. By changing his position, the cyclist reduced the amount of power needed by 49W, more than 12 per cent.
As is often the case with such specialised applications, there’s no off-the-shelf package that meets CPT’s requirements. The testing set-up measures the coefficient of drag along with physiological parameters and simulated weather conditions, and it then extrapolates that data into the final value sought – watts expended. The team does so using sophisticated formulas that factor in aspects such as body and bicycle weight plus the coefficient of rolling resistance to arrive at a real-world value for CDA (drag coefficient and frontal area) per unit of power input.
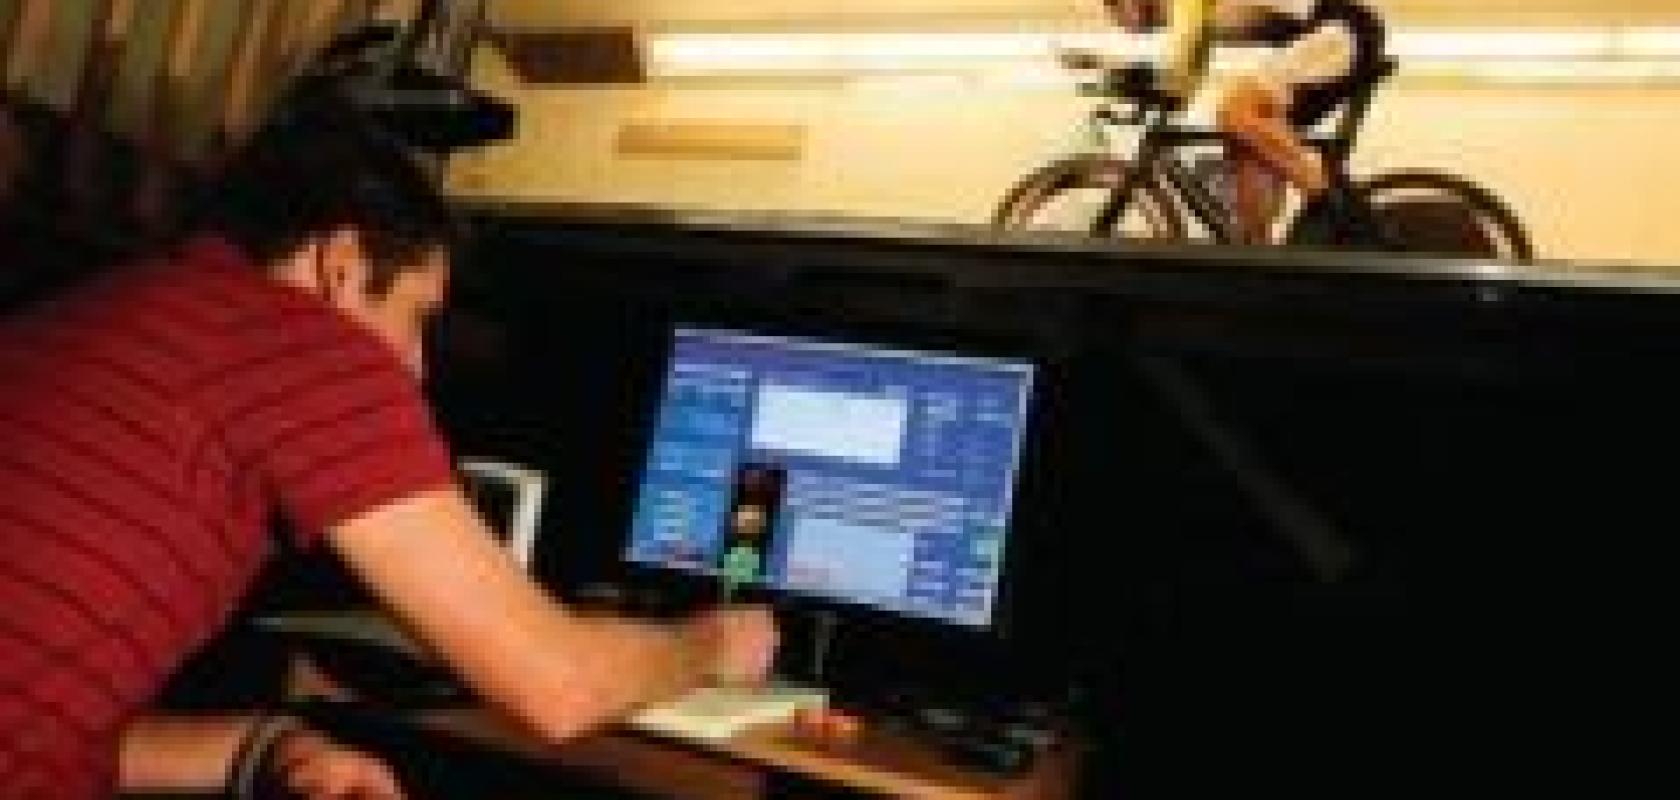
For this purpose, Owens’ group designed an application using LabView software and Compact DAQ hardware, both from National Instruments. A test run consists of a 15-second sample set where the rider’s bicycle is set on a test balance/test bed within the wind tunnel for a static measurement. The wind force, typically 30mph, pushes the athlete back with a force of roughly 6lbs. With this setup, it is possible to measure forces to an accuracy of 1g. The LabView program also coordinates video recordings from three cameras along with still photos of the rider, and this is all written to a PC. In addition, the program can write out results to an Excel spreadsheet so a cyclist or trainer can take the data home and analyse it in more detail with a familiar software tool.
The photo (top) shows a typical 15-second test. On the LabView screen, weather parameters are entered in the box at the lower left. The upper trace shows wind speed, while the lower red trace shows drag force in real time, and the system also gives a digital readout of how many watts of power the rider is generating.
10MB of data per stride
Such motion studies extend to many other sports, as well. For instance, researchers have examined running gaits for years, but there has been little work done on elite runners, worldclass sprinters who can run as fast as 10m/sec. This has become a speciality of researchers in the Biomechanics and Performance Analysis Department at the Australian Sports Commission located near Canberra.
Dr Nick Brown, head of biomechanics, explains that the AIS infrastructure is unique in that it consists of a 100m track equipped with nine force platforms in a row and 22 cameras. The infrared cameras digitise data from roughly 50 reflective markers to create a spatial profile, and this data is combined with impact/propulsive force data collected by four sensors on each force platform as well as electromyography (EMG) data from eight sensors placed on critical muscles of each leg. This results in quite a bit of data: a 0.5-second running stride creates a datafile of 8 to 10MB.

Dr Nick Brown of the Biomechanics and Performance Analysis Department at the Australian Sports Commission discusses results of a test with cricketer Burt Cockley, who has been instrumented with markers that are tracked by Vicon motion-control cameras and software.
The primary software tools that Brown uses come from Vicon, now a part of OMG plc (the Oxford Metrics Group). Brown denotes it as being the dominant software supplier in the motion-capture world for clinical/applied settings. Vicon’s Nexus software recognises cameras as soon as you plug them in, and it supports Gigabit Ethernet cameras with their high frame rates and resolution. In addition, Brown reports that previously it took him multiple days to manually digitise video marker data from several trials, but with Nexus, setup takes perhaps 15 minutes to create a 3D system model describing where the markers will be and then the software tracks them automatically. He can also link impact forces to the markers to help estimate forces within the body; with the package he can calculate movement patterns and estimate loading at any joint of interest.
For further analysis, he moves to Vicon Polygon, a package for creating interactive multimedia reports. It imports text files, data tables, AVI files, photos and even web pages. The data is visualised and fully synchronised, allowing it all to be analysed concurrently on one screen. Instead of viewing a cartoon character, adds Brown, you see an animated skeleton. He feels that this approach is extremely valuable, especially when showing the data to a clinician or coach who can then understand immediately what is going on. For specialised analysis functions not in Vicon software, such as for creating algorithms that detect when muscle signals turn on or off, Brown also writes code in Matlab.
A final analysis step is performed by exporting the Vicon data through Matlab into OpenSim, which is a research project funded by the NIH National Center for Biomedical Computation at Stanford University. This interactive graphical software allows the development of simulations and analysis of the musculoskeletal system. OpenSim is built from computational tools available on SimTK.org including the Lapack linear algebra library, Ipopt optimiser and the Simbody multibody dynamics engine. This software is starting to become a popular alternative to SIMM (Software for Interactive Musculoskeletal Modeling) from Motion Analysis Corp, which until recently was the main package used for such applications.
With OpenSim, Brown can determine which muscles do the most work, which play more of a supporting role, and allows the prediction of average and maximum forces. In studying hamstring injuries, for example, he can observe how much force is present during a running stride and see what level might lead to injury.
Shoes with earthquake technology
Even a serious recreational runner devotes extensive time to finding the best shoes. And shoe manufacturers are employing the latest high-tech software to improve their wares. For example, Adidas combines materials science, biomechanics data collected with a Vicon system along with finite-element analysis (FEA) using Abaqus/Explicit and Abaqus/CAE from Simula (Dassault Systems). With these tools they are creating motionresponsive, stress-reducing technologies – similar to those found in earthquake-resistant buildings and car-stability systems – to put into the heels of running shoes based on its ForMotion technology.

Contour plots generated with Abaqus/CAE that examine the results of biomechanical loading on the heel unit: undeformed state (left) and deformed state (right). In the first round of virtual prototypes, this information warned engineers about the areas that could be prone to excessive strain and lets them modify the design accordingly.
‘Retooling and testing a new shoe can take six to eight weeks,’ notes mechanical engineer Tim Robinson, ‘but with a simulation it takes only a few days.’ A key element of ForMotion is a pair of sliding polyamide plates with a spherical bearing in the heel. Stiffness is provided by a thin polymer seal and sometimes also polymer springs and washers, depending on the shoe model. The sliding plates adjust to shock in 3D, as do auto-banking systems with a similar technology. These plates can decouple to slow down ‘sole angle velocity’, the speed at which the toes slap the ground when the heel makes contact; if this happens too quickly, the result can be shin splints. The plates can also rotate to counteract pronation, the amount the foot rolls inward or outward with each step.
In the design process, surface-based CAD models form the basis for 3D meshes created with Hypermesh, and the meshes are imported into Abaqus/CAE. In that environment, the engineers apply properties for proprietary materials from custom libraries, and they tie everything together to define contact, friction, connectors and other factors. Then they solve the model using Abaqus/Explicit. Additionally, biomechanics data is collected with markers and Vicon cameras and software as a runner moves along a test track. In post-processing, the engineers look for areas of strain or friction by applying simulated horizontal and vertical displacement forces. The modelling software allows them to look ‘inside’ the shoe, which is vital when developing a complex system that includes plates, seals, springs and washers. Finally, because shoe size generally correlates well with body weight, they use the FEA software to predict the optimum stiffness of the heel unit for each shoe size.
Measuring ‘invisible’ injuries
Concussions and other mild traumatic brain injuries are sometimes called ‘invisible injuries’, because symptoms might not appear for 24 hours or later. Motor skills might not be immediately impaired, nor may an athlete be aware of the injury, making detection and evaluation extremely difficult for sideline personnel. This is a concern no matter what the age. In fact, the Center for the Study of Traumatic Encephalopathy at the Boston University School of Medicine recently found that damage from chronic traumatic encephalopathy (CTE) appeared in the brain of an 18-year old athlete who suffered multiple concussions. They are also learning that CTE is a progressive disease that resembles Alzheimer’s and eventually kills brain cells.


A special football helmet from Riddell (left) incorporates six accelerometers that are tied to a microprocessor and a wireless link. Players can experience accelerations to levels as high as 150g. Software for the Sideline Response System (right) gives instant analysis of a hit along with historical data.
To detect concussions when playing American football, Simbex LLC has developed the HIT (head impact telemetry) system, which the football-helmet manufacturer Riddell has incorporated into its Sideline Response System. The HIT system measures head accelerations (impacts) in real time during games and practices. A special Riddell helmet embeds six copies of a specialised pad that contains an accelerometer, microprocessor and a transmitter. The HIT system measures the location, magnitude, duration and direction of head acceleration. When it detects a suspect impact profile for a particular player, an alarm pager alerts the medical or training staff.
Last year, more than 600 American football players from the high school to pro levels were outfitted with HIT monitors, and they registered 35,000 impacts that in turn resulted in 45 concussions. The typical football Modelling biomechanics impact, explains Jeff Chu, Simbex’s director of engineering, is 20g, not much harder than the foot hitting the ground when running. Severe impacts in football can reach 60g to 80g, which is equivalent to a car crash at 30mph, and in very rare cases an impact can reach 150g. Researchers have determined that there is a large spread of impact forces that can lead to a concussion, from 60g to 150g, but not every athlete suffers a concussion for the same impact.
The onboard processor must distinguish between helmet accelerations (including vibrations when helmets collide) and head acceleration. This is done first with filtering built into the accelerometers, while the processor in the sensor module further improves the signal/noise ratio while yet other algorithms decompose the data into three-axis linear and three-axis rotational motion.
A data converter reads accelerometer threshold and then digitises the six sensor channels for 40ms at 1kHz. A typical ‘hit’ on a football field lasts 8 to 20ms. The impact data can be immediately downloaded to a sideline monitoring unit over a wireless link, but the maximum range is limited, because these systems are often used in extremely harsh RF environments, such as stadiums with television cameras or other wireless links in action.
Modelling and engineering software is playing an ever-increasing role in helping athletes achieve that extra one or two per cent of performance that can make the difference between winning and losing.
