The first papers describing the use of microarrays to analyse gene transcription data were published hardly more than a decade ago. However, although just 10 years old, this technology is mature and ubiquitous.
Two years ago, statistical geneticist David Allison of the University of Alabama, USA, could already describe microarrays as ‘…almost as widely used as measurement tools in biological research as Western blots’. Yet microarray data, unlike Western blots, requires complex statistical analysis to interpret, and medical researchers in industry and academia are often notoriously illiterate in this area. The range of specialist software tools for statistical analysis of microarray data available from both commercial companies and academic groups is large and growing. To add a further layer of complexity, array technologies are diverging and being applied to a far wider range of applications. Software companies are building a new set of tools to help tackle these applications, but there is still little consensus about which to choose.

Image shows microarray data of budding yeast transfected with CDC14 under the control of a galactose-inducible promoter. Image courtesy of German Cancer Research Center.
In the most simple and general terms, any array technology involves the immobilisation of large numbers of one type of molecule (most often DNA) as spots or probes on a slide or chip. Complementary molecules generate signals by binding to the spots on the array and the signals are then analysed to determine the type and quantity of such molecules present.
In a ‘classic’ microarray experiment to measure gene transcription, the immobilised molecules are segments of complementary DNA (cDNA) taken from the coding regions of genes, and the samples investigated contain RNA transcripts. The intensity of the signal obtained at each probe is proportional to the number of transcripts of that particular gene present in the sample. In a two-colour microarray, samples from, for example, tumour cells and normal ones of the same cell type are labelled with different fluorescent dyes and bound to the same array. The more precise, and now more popular, single-colour arrays are created by synthesising DNA probes in situ on the arrays, and a single sample is applied to each. Affymetrix, based in Santa Clara, California – the company that became so synonymous with single-colour microarrays that these are often referred to as Affymetrix or ‘Affy’ arrays – is still a leader in the field.
California has something of a monopoly of microarray companies: two other significant vendors, Agilent and Illumina, are also based there. Agilent was spun out of Hewlett- Packard in 1999, just after the first microarray experiments were published. ‘We exploited inkjet technology developed within HP to make microarrays, effectively “printing” with DNA instead of ink,’ says Kevin Meldrum, senior director of business development at Agilent. ‘It is a very flexible technology, and can give very high precision.’ Agilent manufactures both single- and two-colour arrays, as well as a complete range of analysis software. Array manufacturers all provide software tools for image analysis – turning the recorded image of the microarrays into an array of data points or pairs representing the intensity of signal at each spot – and, very often, at least some software for pre-processing or ‘normalisation’ of the data. Unlike some companies, however, Agilent also sells software for the visualisation and statistical analysis of the resulting data. ‘Our acquisition of Silicon Genetics in 2004 gave us access to their GeneSpring software suite. This offers a wide range of tools for the visualisation and interpretation of gene expression data, and we have expanded it to provide specialist programs for the new applications of array technology that are now coming on-stream.’

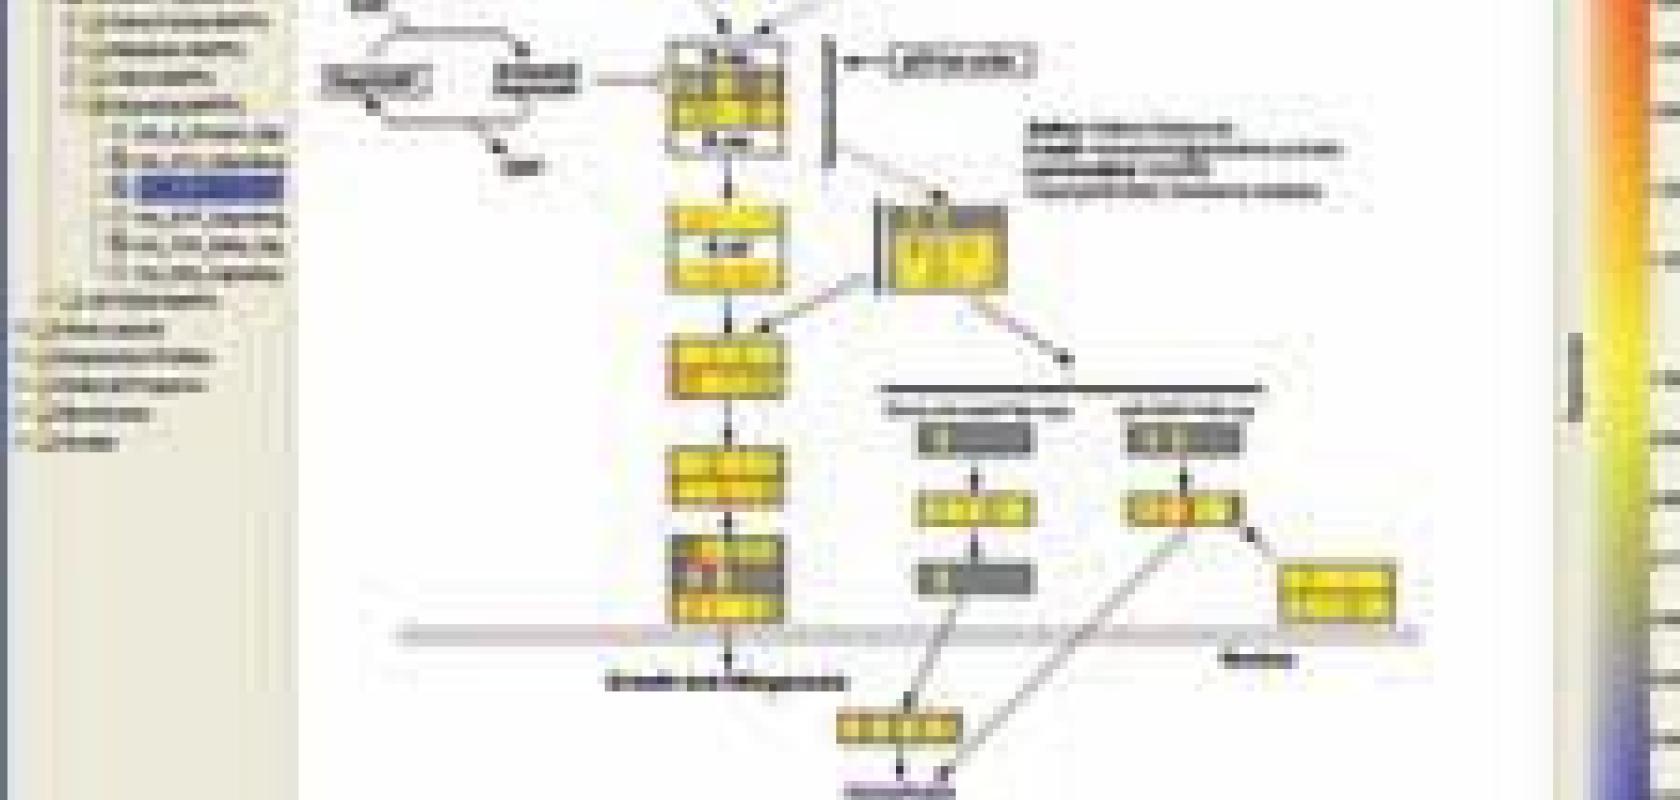
Partek’s Genomics Suite supports several platforms.
Agilent’s software, understandably, has been optimised to work with Agilent chips. However, specialist commercial software companies, including Missouri-based Partek, can gain by independently supporting several platforms. ‘A lab might be analysing gene expression using Affy chips, but have chosen Illumina for SNP analysis and Agilent for copy number. Our Partek Genomics Suite provides powerful analysis software compatible with all these, and this has fuelled our 70 per cent or more growth in 2007,’ says Partek’s president, Tom Downey.
While pharmaceutical industry researchers will almost invariably choose commercial analysis software, many academic groups develop and share their own. BioConductor, from a team based primarily at the Fred Hutchinson Cancer Research Center, Seattle, is probably one of the most widely used of such tools; others include Expression Profiler, developed by Misha Kapushesky and colleagues at the European Bioinformatics Institute, near Cambridge, UK. Kurt Fellenberg, a senior bioinformatician at the German Cancer Research Center in Heidelberg, and developer of M-CHiPS (Multi-Conditional Hybridization Intensity Processing System), has many years’ experience of using academic software and is well aware of its advantages and disadvantages. ‘We often find we need to use specialist tools that have been developed by other academics,’ he says. ‘Typically, this software is perfectly statistically rigorous, but it is often poorly documented, it can be buggy, and it rarely runs on all possible computer platforms.’ He has just obtained a grant of e200k to produce a commercial version of M-CHiPS, which will be better documented and more user-friendly than the free one. He hopes that it will be launched by the end of 2008. ‘We will then have to start persuading people to choose it, which may not be easy in such a crowded market,’ he adds.
Microarrays were developed for the analysis of gene transcription, and this is still an important application. However, novel applications of the basic array technology began to appear about five years ago. One is the use of arrays to analyse chromosomal copy number aberrations from DNA samples.
Over- or under-expression of genes, caused not by errors in transcription or processing, but through an abnormal number of copies of that gene being present in a cell, may either be benign or result in serious disease. The most dramatic outcome of copy number variation must be in the trisomies, where a foetus develops with an extra copy of one whole chromosome. The most commonly observed trisomy is Down’s syndrome, where an extra copy of chromosome 21 gives rise to a range of characteristic physical and learning disabilities. The gain or loss of small parts of a chromosome can also cause disability: one example is DiGeorge syndrome, in which a part of chromosome 22 that contains several genes is missing. Furthermore, copy number is implicated in cancer, a well-known example being the association of some types of breast cancer with multiple copies of the herceptin receptor (HER2) gene.
Any technique that can determine gene copy number across the genome in a sample of cells will therefore have important medical applications, particularly in diagnosis of congenital disorders and in sub-classifying tumours to determine the optimum treatment. The microarray technology, known as comparative genomic hybridisation (CGH), can address this. In CGH, two samples of genomic DNA are labelled with different fluorescent dyes and hybridised to a single two-colour microarray. A difference in copy number between the samples can be detected from a difference in signal strength between the dyes. ‘Now CGH is becoming routine, we need to build genome-wide databases of copy number variation, in order to determine which variations are pathological and which are within the normal range,’ says Meldrum. His company, Agilent, now develops arrays containing DNA probes for copy number analysis ranging across the whole human genome.

An example of how Agilent’s GeneSpring GX bioinformatics software shows how genes fit into a biological pathway and their relative expression levels. This helps scientists recognise the biological functions of genes.
Other popular ‘newer’ applications of the basic microarray technology are the detection of single nucleotide polymorphisms (SNPs) and, more experimentally, the analysis of DNA methylation. About four per cent of the cytosine residues in the human genome are methylated, and patterns of cytosine methylation are now known to affect gene expression. David Allison, however, is not satisfied with the statistical quality and rigour of many of the microarray studies that are currently published, and he sees the sheer variety of tools available as just as much a challenge as they are a solution. ‘Although there are many good methods of preprocessing microarray data, there is no universally recognised “optimum” one,’ he says. ‘As scientists, we don’t want to be prescriptive when it’s not necessary, but it’s not clear that arrays pre-processed and analysed using different methods can be completely comparable.’ He also sees problems with many scientists using insufficient sample sizes, and with some journals giving insufficient priority to statistical rigour. ‘If the biological result presented is “sexy” enough, and particularly if there is an important medical application, even high profile journals often fail to scrutinise the statistical analysis to check that it is presented carefully enough.’
The Microarray and Gene Expression (MGED) society – founded, as its name implies, before anyone had tried to apply microarrays to anything but the analysis of gene expression – comprises both biologists and data analysts. It has set out to impose standards on the reporting of microarray experiments. The MIAME standards, published in 2001, describe the ‘Minimum Information About a Microarray Experiment’ that the society’s leaders believe is needed to enable that experiment’s results to be interpreted without ambiguity. Allison describes the introduction of these standards as ‘very helpful’, but others in the field believe the information prescribed by the standards to be useful, but not sufficient. ‘The MIAME standards don’t require the recording of some information, such as the date and/or batch that a particular experiment was performed; that is becoming more important as the volume of data available grows. Maybe we should move to NIAME – Necessary Information About a Microarray Experiment – but the community would need to come to a consensus about what more is necessary,’ says Downey.
Experimental biologists involved in microarray experiments need more training in statistics, but the software community must take the responsibility of providing products that are statistically rigorous, but remain easy to use. It is there that, as ever, commercial software has the edge over products in the public domain. And, as Fellenberg quips: ‘The employment prospects for statisticians working in this field will be secure for some time to come.’
