
High performance computing is a field in which engineers often require knowledge of many different areas. An HPC developer must implement a solution to a problem which comes from ‘real’ science, but they also need to understand computer hardware and software. Understanding and improving the performance of an application is a difficult challenge and tools that can help are usually welcome.
In this article we will discuss how to understand the factors which frequently limit the performance of code on modern hardware, and, in particular the issue of data movement. When we are optimising our objective is to determine which hardware resource the code is exhausting (there must be one, otherwise it would run faster!), and then see how to modify the code to reduce its need for that resource. It is therefore essential to understand the maximum theoretical performance of that aspect of the machine, since if we are already achieving the peak performance we should give up, or choose a different algorithm.
The Roofline model provides us with a way to understand the trade-off between data-movement and computation so that we can understand which factor is limiting our code, and how close to the limit we are. It has been heavily used recently to characterise HPC applications and understand their potential for performance improvement. Intel Advisor implemented a Cache Aware Roofline Model (CARM) a few years ago. This provides a very powerful way to characterise HPC applications. More recently, the software implemented an additional version of the Roofline model called the Integrated Roofline, which allows it to detect specific bottlenecks related to threading and vectorisation, as well as inefficient data transfers between each level of memory (Level 1 cache, Level 2 cache, Level 3 cache, memory).
If you are tuning compute intensive code, you need to understand data movement, and the roofline model is a good way to do that.
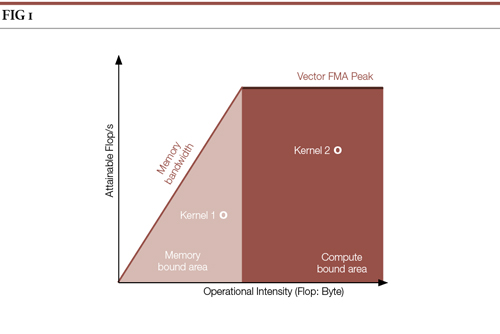
The main aim of the Roofline model is to incorporate performance, memory bandwidth, and memory locality metrics into a unified chart for the kernels of the analysed program. By comparing where each kernel is in the Roofline model, we can see how near it is to the compute and memory roofs and we can get a measure of how much system performance is not exploited.
The original Roofline model developed by Berkeley focuses on the performance of specific kernels (in floating-point operations per second) mapped to the operational intensity which represents the ratio of floating-point operations to bytes of traffic transferred between the caches and DRAM. The computational performance roofs represent the maximum capabilities of the platform. For a modern processor the maximum (peak) performance for floating point operations is considered to be vector Fused-Multiply-Add (FMA) instructions. When other instructions are used, the peak performance may vary and multiple computational roofs can be included in the model based on the instructions used in the code, the data types processed and the machine architecture.
The memory bandwidth limit of the system is represented by the maximum main memory bandwidth in this roofline model. For any specific kernel plotted on such a chart the model gives a general answer about whether the kernel is memory- or compute-bound and suggests the general optimisation direction. However, the original roofline model does not give specific insight into which types of memory optimsations are profitable for the kernel and whether particular cache levels limit the performance.
Cache Aware Roofline Model Analysis Implementation in Intel Advisor
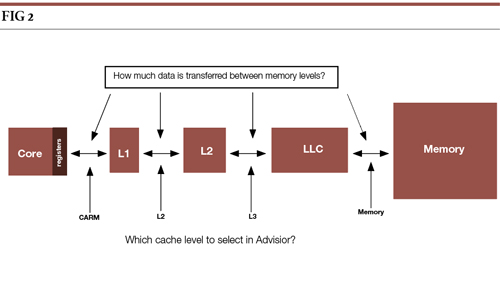
CARM was developed to provide additional information about application kernels’ performance in a system with caches. This new model considers bytes of traffic transferred from CPU cores to each level in the memory hierarchy, making it easier to understand which cache-levels are important for optimisation.
Intel Advisor analyser implements the automatic collection of CARM for user applications. It does this by using instrumentation to understand your code. By running the instrumented application, it can count all the arithmetic operations and memory movements. To build the model it must acquire three types of performance data: the number of floating point operations, the amount of data that was transferred to execute those operations, and the execution time of the different sections of code. The instrumentation provides an accurate counting of the floating point operations based on what was really executed by the machine, allowing for masking I vector operations. This counting doesn’t rely on performance counters and is not sensitive to any specific hardware. Counting the memory movement is also implemented by instrumentation, checking what ends up in the registers. This approach ensures that for a given platform and algorithm, the ratio of operations and memory transfers will stay the same, no matter what optimisations are implemented or the size of the dataset used, providing the CARM with strong characteristics to analyse an algorithm.
The implementation also has the advantage that the overhead (of around seven times slowdown) is bearable. To avoid impacting the performance of the application when measuring the execution time of each kernel, Intel Advisor split the analysis into two runs.
The first run uses sampling to time each uninstrumented kernel. The second run uses the instrumented kernel to count the flops, the memory transfers and the trip counts. Then, data from the two runs are merged to extract a set of metrics for each kernel such as the performance (flop/s) and the Arithmetic intensity (flop/byte). Even if detecting performance issues is possible with this model, identifying a bottleneck is challenging as every optimisation (memory, threading, vectorisation) will affect only the vertical position of a kernel plotted on the roofline model (flop/s). This is where the Integrated Roofline Model becomes interesting.
Integrated Roofline Model
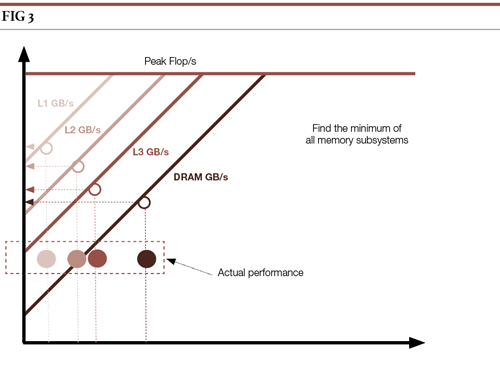
The Integrated Roofline Model (IRM) implementation uses more than just code instrumentation. Intel Advisor also implements a cache simulator which can reproduce the behaviour of different cache levels. Using the cache simulator, it becomes possible to count the memory transfers between the cache levels. For a single loop, we can now generate several data points on the roofline plot for a single kernel, depending on whether we consider data transfers between registers and cache, L1 and L2, L2 and L3, L3 and memory.
Having several points on the roofline for the same loop brings many new possibilities in terms of interpretation. First of all, the way to interpret the theoretical maximum performance changes, as each dot must be projected on its appropriate roofline depending on the memory subsystem used.
Identifying vectorisation, threading and latency issues
The first problems which can easily be identified are inefficient vectorisation. Intel Advisor can display the IRM for a single thread.
In this situation, if we see that every dot is far from its dedicated roofline (as in the diagram), inefficient vectorisation is likely. In this case, it is important to check that loops were correctly vectorised.
In some cases, this problem can also happen on vectorised loops, meaning that vectorisation suffers from inefficient data accesses, due to latency.
Identifying threading issues can be done by running your analysis on a multithreaded system and displaying the roofline for all the threads used.
If all the dots of a single kernel are far from their respective rooflines and you had previously solved your vectorisation issues, threading might be the reason for your suboptimal performance.
Identifying cache overload
The IRM also allows us to identify too high a pressure on a given cache level. Observing the different arithmetic intensities of a single kernel at different memory subsystem levels provides meaningful information on how much pressure is inflicted on each cache/memory level.
A low arithmetic intensity for a given cache level will increase the chance that this cache is a performance bottleneck.
Usage of Non Temporal Stores (NTS) can also affect performance by releasing the pressure on caches. NTS allows the core to write data directly to memory. In some cases, when a kernel writes data that will not be used in the near future, there is no need to maintain this data in the cache (displacing useful data, and unnecessarily increasing the overhead of maintaining cache consistency).
Asking the compiler to generate NTS can therefore improve the performance by reducing pressure on caches. Based on the code, the software can recommend the use of NTS, instead of regular store operations.
Identifying inefficient memory access patterns
IRM helps us to identify inefficient memory access patterns by checking the dots for a given loop/kernel order from left to right. By default, we expect that, for a single kernel, the dots will be displayed in the following order (from left to right): CARM/L1, L2, L3, DRAM.
There are two cases where this order might not occur. Use of NTS is one. As the processor directly writes data from registers to memory, it is possible to see more data transfer on the DRAM side than at some other cache levels.
In that case, DRAM arithmetic intensity could be lower than L3 or L2 arithmetic intensities. This behaviour usually doesn’t need to be fixed.
The other case is when the kernel is performing non-unit strides. If so, the CARM arithmetic intensity could be higher than L2 or L3 as every movement in any cache transfers a whole cache line, not a single value.
When this is observed, it is usually good practice to check how the data are laid out in memory and accessed. This can be done by running the Memory Access Pattern analysis (MAP).
Conclusion
Intel Advisor offers two different implementations of the roofline model that can answer different needs. The CARM is a very powerful tool for characterising an algorithm on a platform.
On the other hand, the IRM offers many possibilities to track down problems related to vectorisation, threading or memory, offering an important tool to help optimise an application.
Kate Antakova is a software developer at Intel Corporation, Cedric Andreolli is Intel's HPC application engineer, and Jim Cownie is a senior principal engineer at Intel Corporation UK.
